There was a time when engineering intelligence meant showcasing lines of code written by developers on a glorious dashboard.
Then came the backlash. Measuring programming progress by lines of code is like measuring cloud performance by server count instead of uptime and latency.
Fast forward to the 2010s - velocity took the throne. And the definition of engineering intelligence got changed from lines of code written to shipped story points in each sprint.
Velocity had the same problem. It measured output, not outcomes.
So, then, came DORA metrics. Backed by Google's DevOps Research, it was the first framework that actually correlated engineering behavior with business performance.
Software Engineering Intelligence Tools like LinearB found their silver lining here. LinearB arrived as a breath of fresh air. Git-native, DORA-aligned, and workflow-aware - the platform offered some serious value. And many teams in 2020-2022 felt it too.
Then why are teams abandoning LinearB in 2026?
LinearB was built around a Git-centric, per-contributor model, struggling to flex into the space where engineering analytics means AI-driven insights, not just dashboards, real-time bottleneck detection, AI adoption measured in production, not just AI usage, and predictive throughput, not just historical reports.
The complaints are consistent across Reddit threads, G2 reviews, and engineering Slack communities.
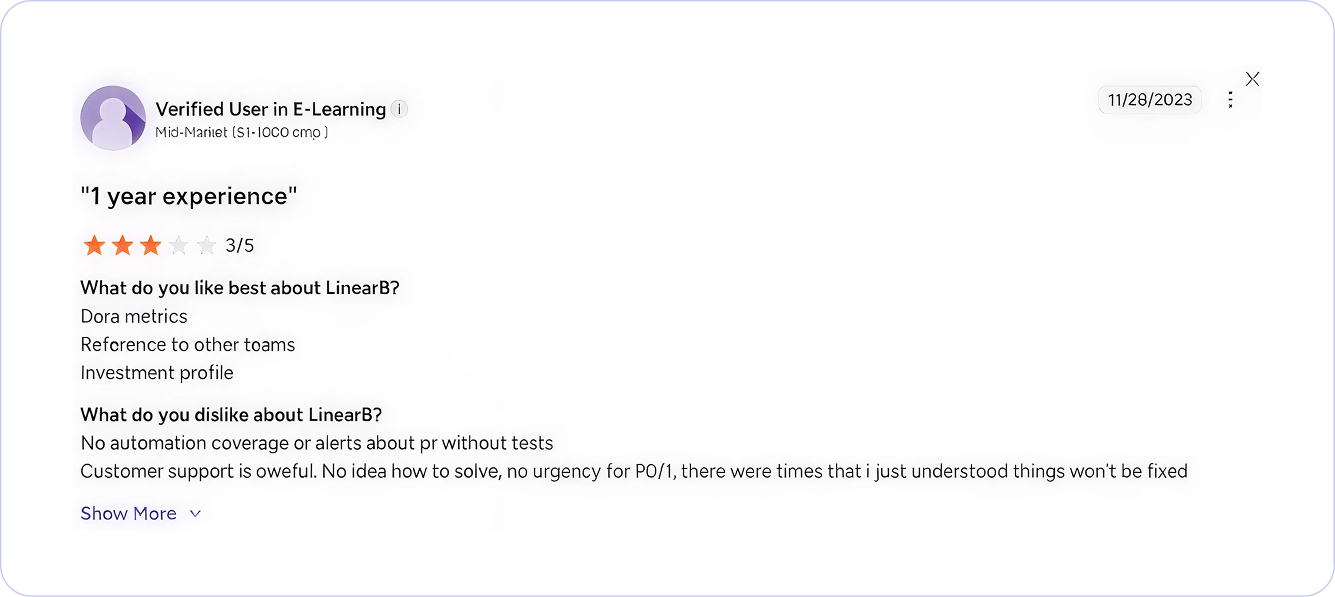
For example, as per the following review left by a real user on G2, LinearB still scratches the surface by showcasing lines of code written when engineering leaders actually want to have insights into how much AI-written code goes to production, and how it correlates to DORA metrics and review bottlenecks in the team.

Moreover, in this Reddit thread, the user shared a less-than-ideal experience with LinearB - prioritizing automation at the cost of real insights that engineering leaders actually need.

Signs you’ve outgrown LinearB
- You've adopted AI coding tools - but you're running blind on impact
- Your board wants business outcomes. LinearB gives you engineering metrics
- Teams complain about too many dashboards, not enough insights
- You're reacting to delivery problems instead of predicting them
- Pricing grows fast as the team scales
So, considering the shift, let’s put down the top 8 LinearB alternatives that better fit a 2026 world of AI-assisted engineering - where the goal is not merely tracking metrics, but improving throughput, removing bottlenecks, measuring AI impact, and helping teams ship meaningful work faster. But before that, let’s quickly discuss.
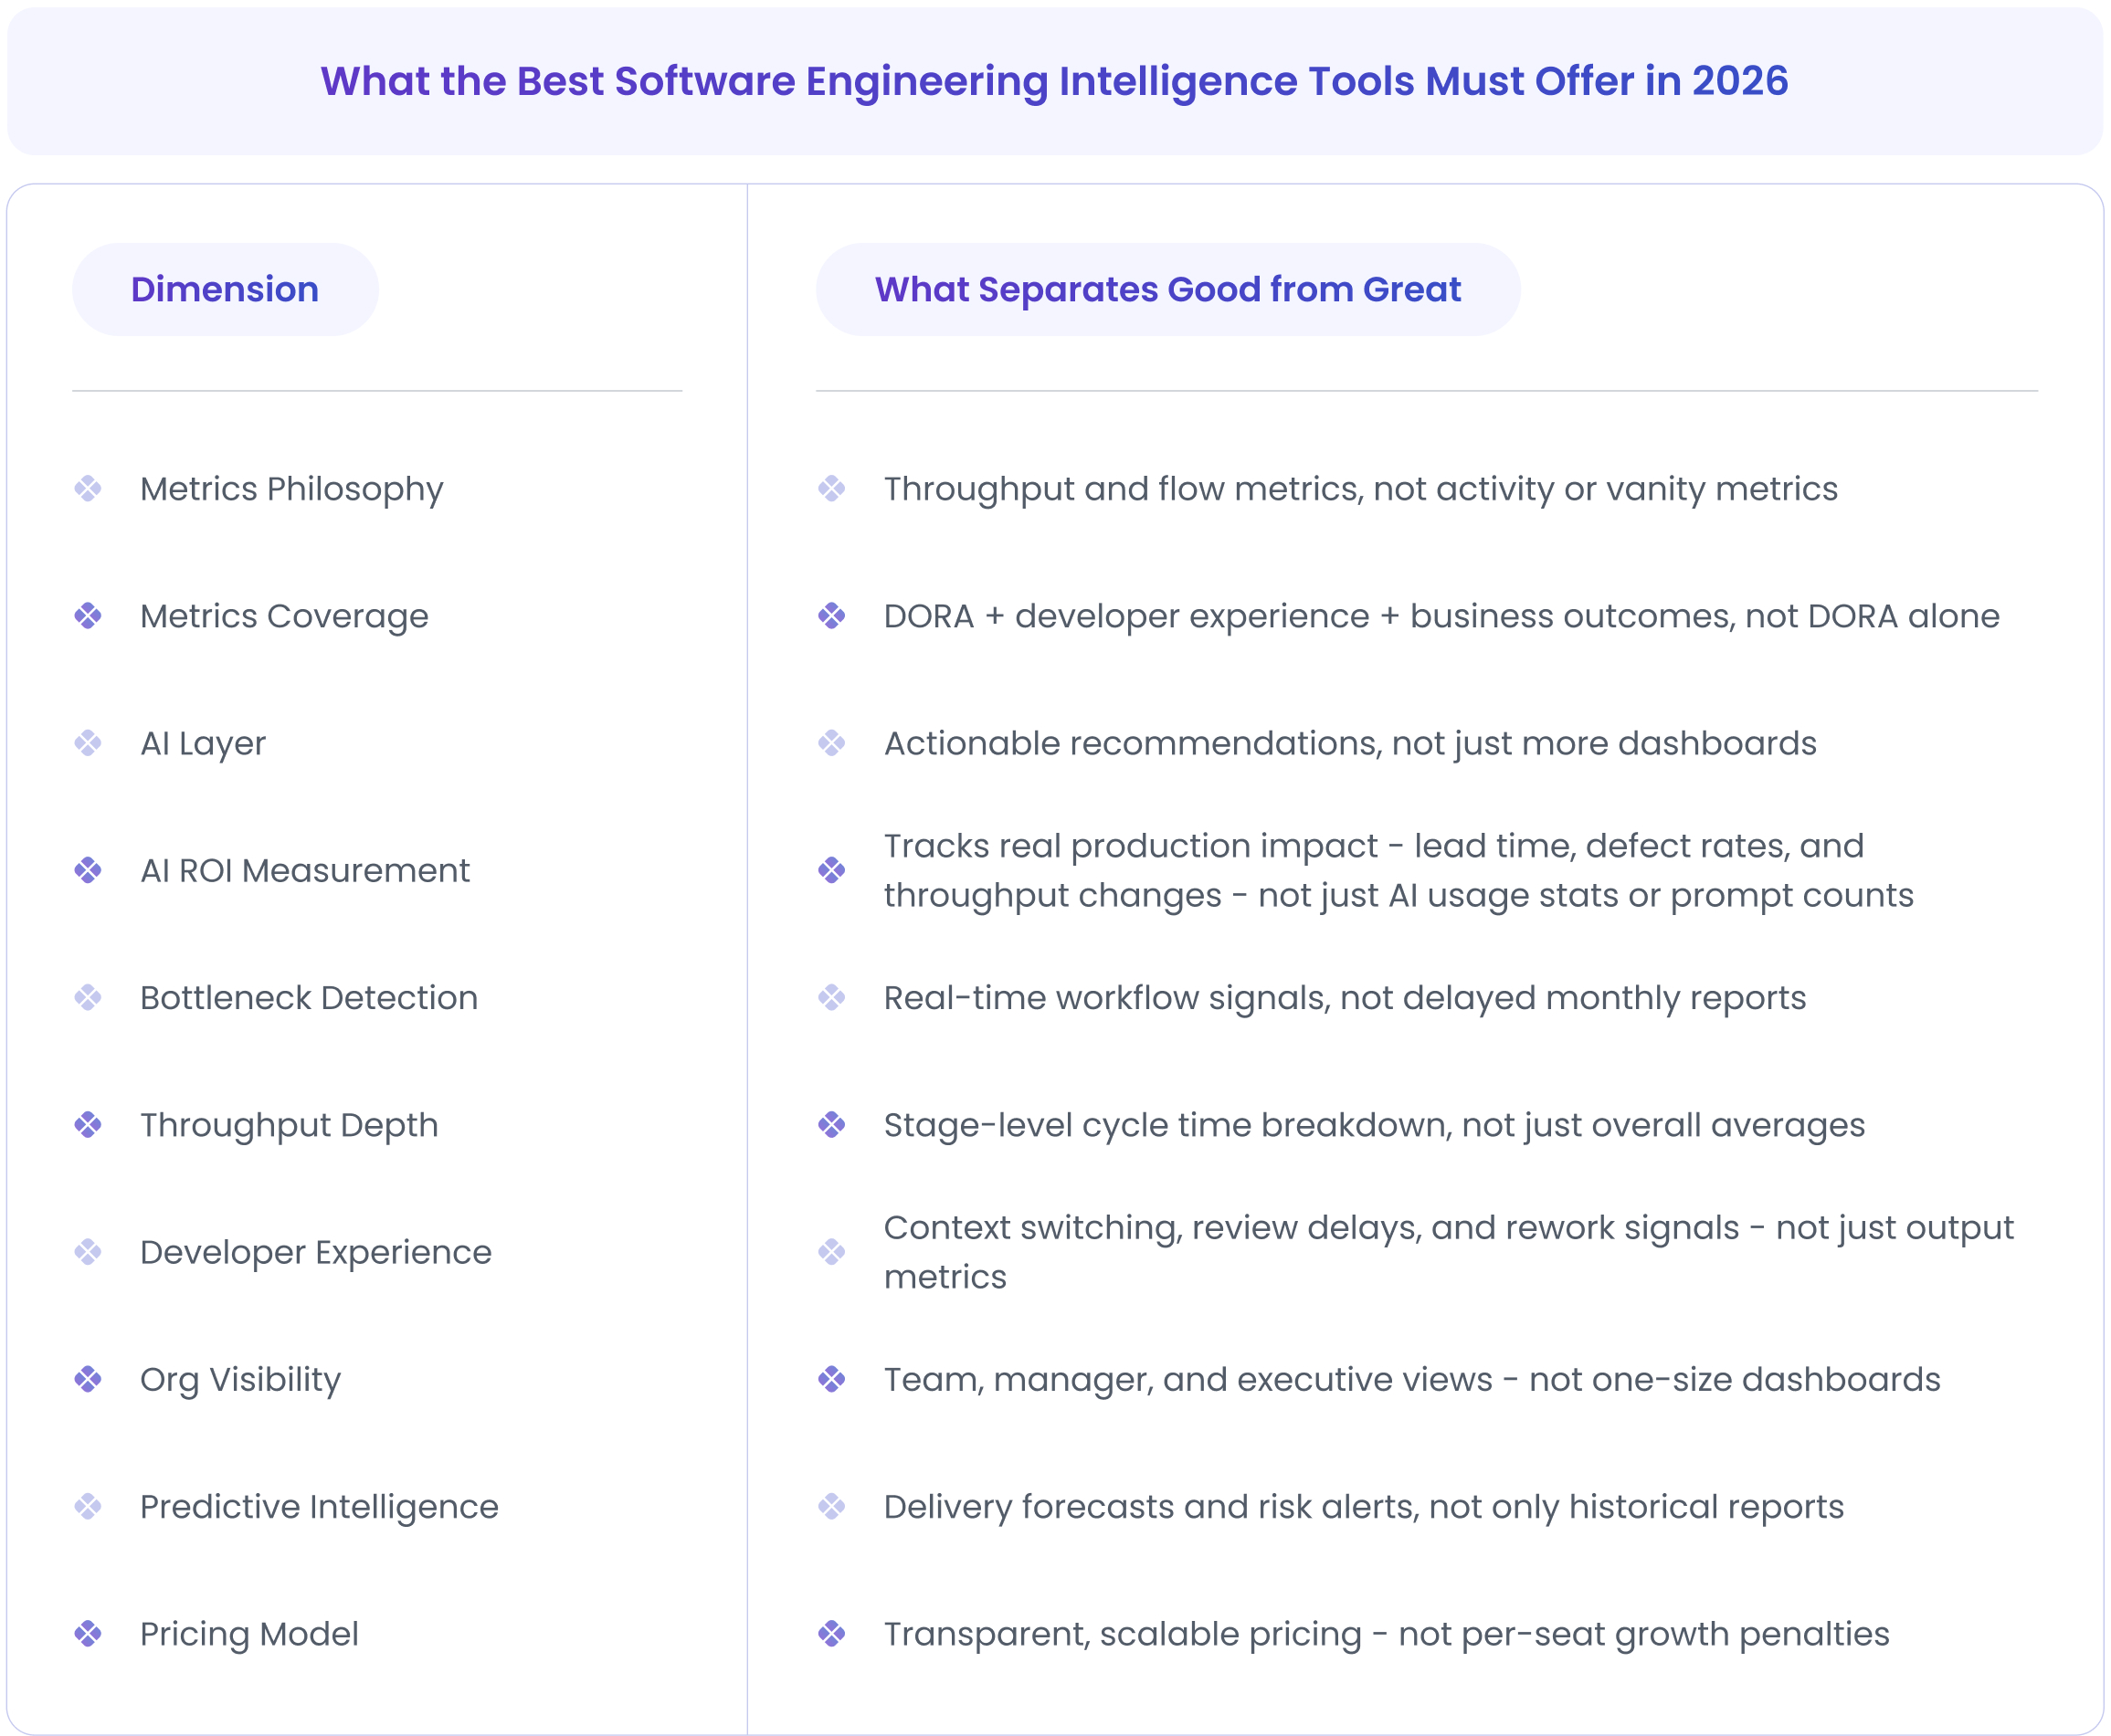
What the Best Software Engineering Intelligence Tools Must Offer in 2026
Here are the core capabilities that matter in 2026.
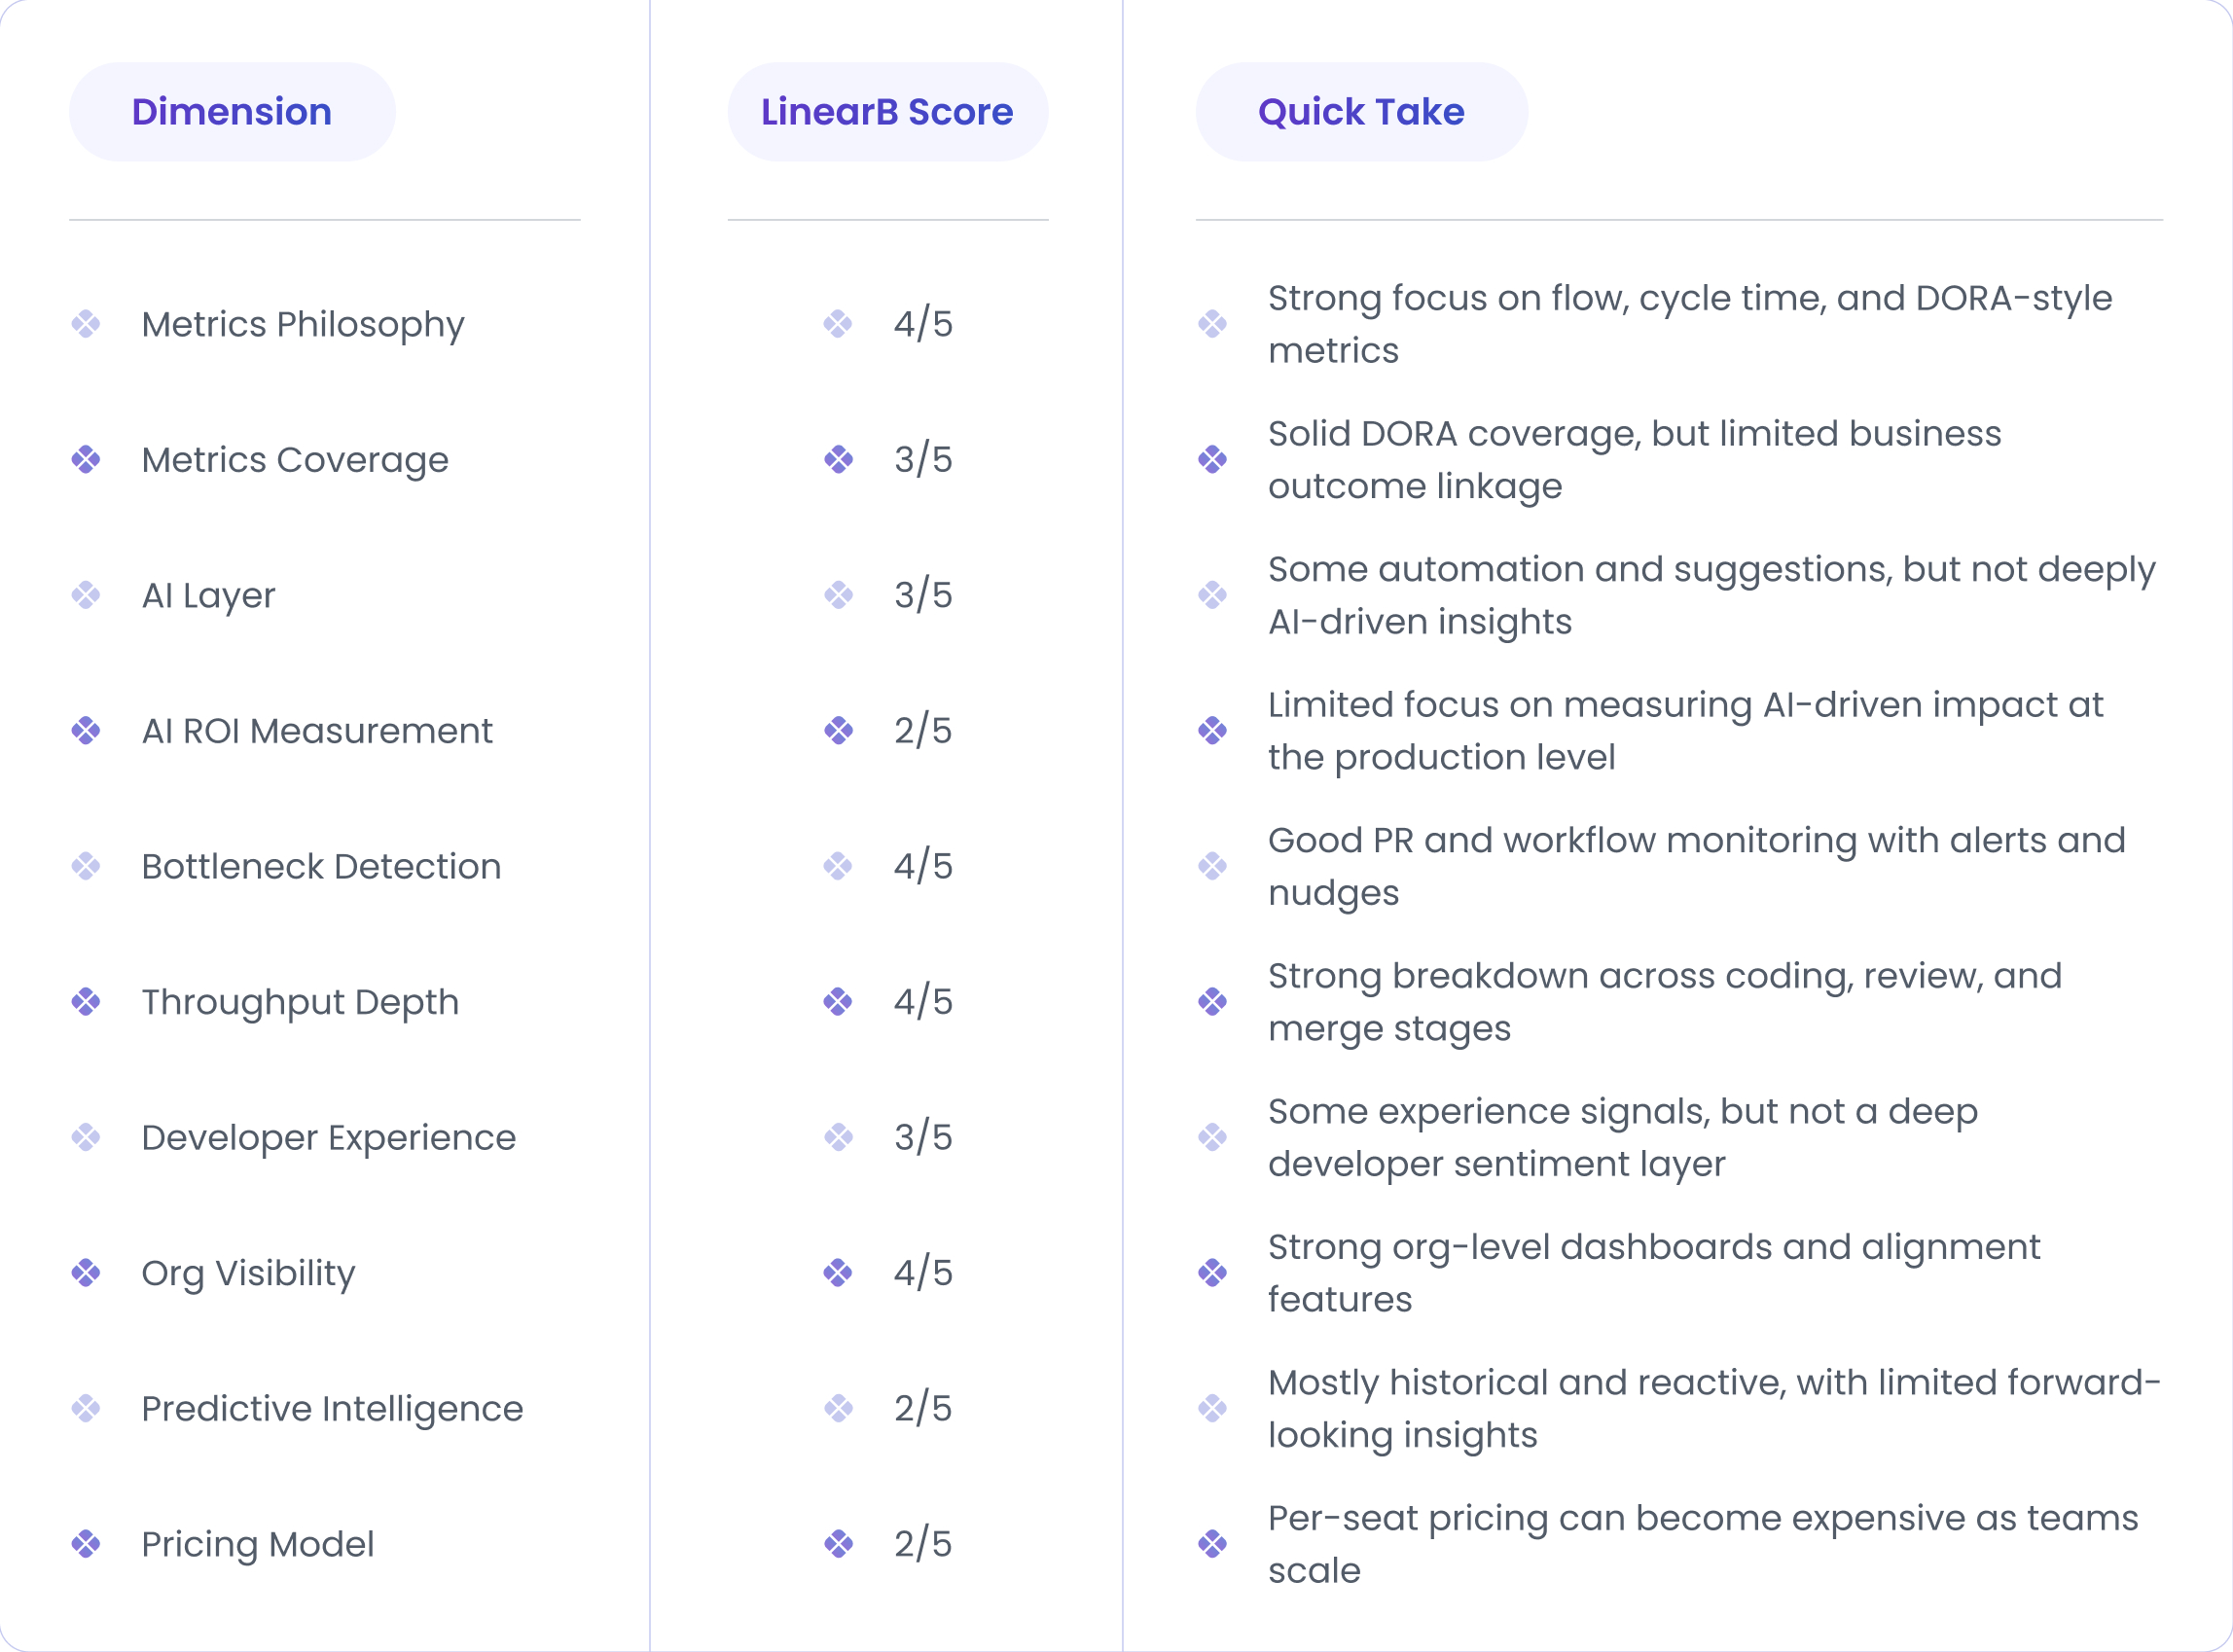
How LinearB Scores Against the 2026 Engineering Analytics Intelligence Dimensions
Scoring logic:
- 5/5 = Strong, industry-leading capability
- 3/5 = Decent support, but with gaps
- 1/5 = Limited or mostly absent
What are the Best LinearB Alternatives for Engineering Analytics in 2026?
Not all LinearB alternatives are built the same - each targets a different gap, from AI ROI measurement to developer experience to predictive delivery. Here's a quick side-by-side to help you zero in on the right fit for your team.

1) DX
Best For:
Organizations that want to measure and improve developer productivity through developer experience and team health signals.
Overview:
DX is a powerful engineering intelligence platform built by keeping the developer experience at the center of everything. It is driven by the idea that developer experience drives productivity. DX contextualizes performance with 180,000+ industry benchmark samples.
DX's founders previously built Pull Panda (acquired by GitHub) and GitPrime (now Pluralsight Flow) - and felt unsatisfied with the results customers were seeing from those tools.
Instead of focusing purely on system data, DX combines system data with direct developer feedback and offers a more complete view of engineering performance.
The platform is based on the SPACE framework, which measures productivity across satisfaction, performance, activity, communication, and efficiency.
DX launched the DX AI Measurement Framework - a research-based set of metrics specifically for measuring the impact of AI-assisted engineering.
Compared to LinearB, which is more focused on flow metrics, DX puts strong emphasis on developer sentiment, team health, and experience-driven productivity.
Key strengths:
- SPACE framework–based metrics for a holistic view of productivity
- Developer sentiment surveys to capture real experience data
- System + survey data correlation for deeper insights
- Team health and burnout risk signals
- Executive dashboards focused on productivity trends
2. Jellyfish
Best for:
Large engineering teams that want strong correlated insights between engineering work, resource allocation, and business priorities.
Overview:
Jellyfish is another best alternative to LinearB, designed to give leaders visibility into how engineering work connects to strategic business outcomes.
Jellyfish is powered by a patented allocations model and boasts the industry's largest customer dataset. It's an automatically calculated map of where every engineer's time is going across features, bugs, tech debt, and strategic initiatives.
Rather than focusing only on delivery speed or PR-level metrics, Jellyfish puts more emphasis on resource allocation, planning, and investment insights. With that, leaders can easily understand where engineering time is going and whether that effort supports company goals.
Key strengths:
- Connects engineering work directly to strategic goals and OKRs
- Shows how engineering time is distributed across features, tech debt, bugs, and initiatives
- Translates technical metrics into business impact and planning insights
- Helps leaders plan staffing, priorities, and delivery timelines
- Combines system data with sentiment data to identify productivity blockers
3. Hivel
Best for:
Teams that want AI-native engineering intelligence focused on real production outcomes in both manual and AI-assisted engineering pipelines.
Overview:
Hivel is an AI-native Engineering Intelligence platform built for the AI-assisted development practices. Instead of focusing only on traditional flow metrics, it offers context-rich insights into AI adoption, production outcomes, and executive-level impact.
Hivel quantifies where AI helps versus harms - specifically identifying teams creating silent tech debt through AI-generated code. Most tools measure AI adoption. Hivel is one of the only ones that measures AI damage!
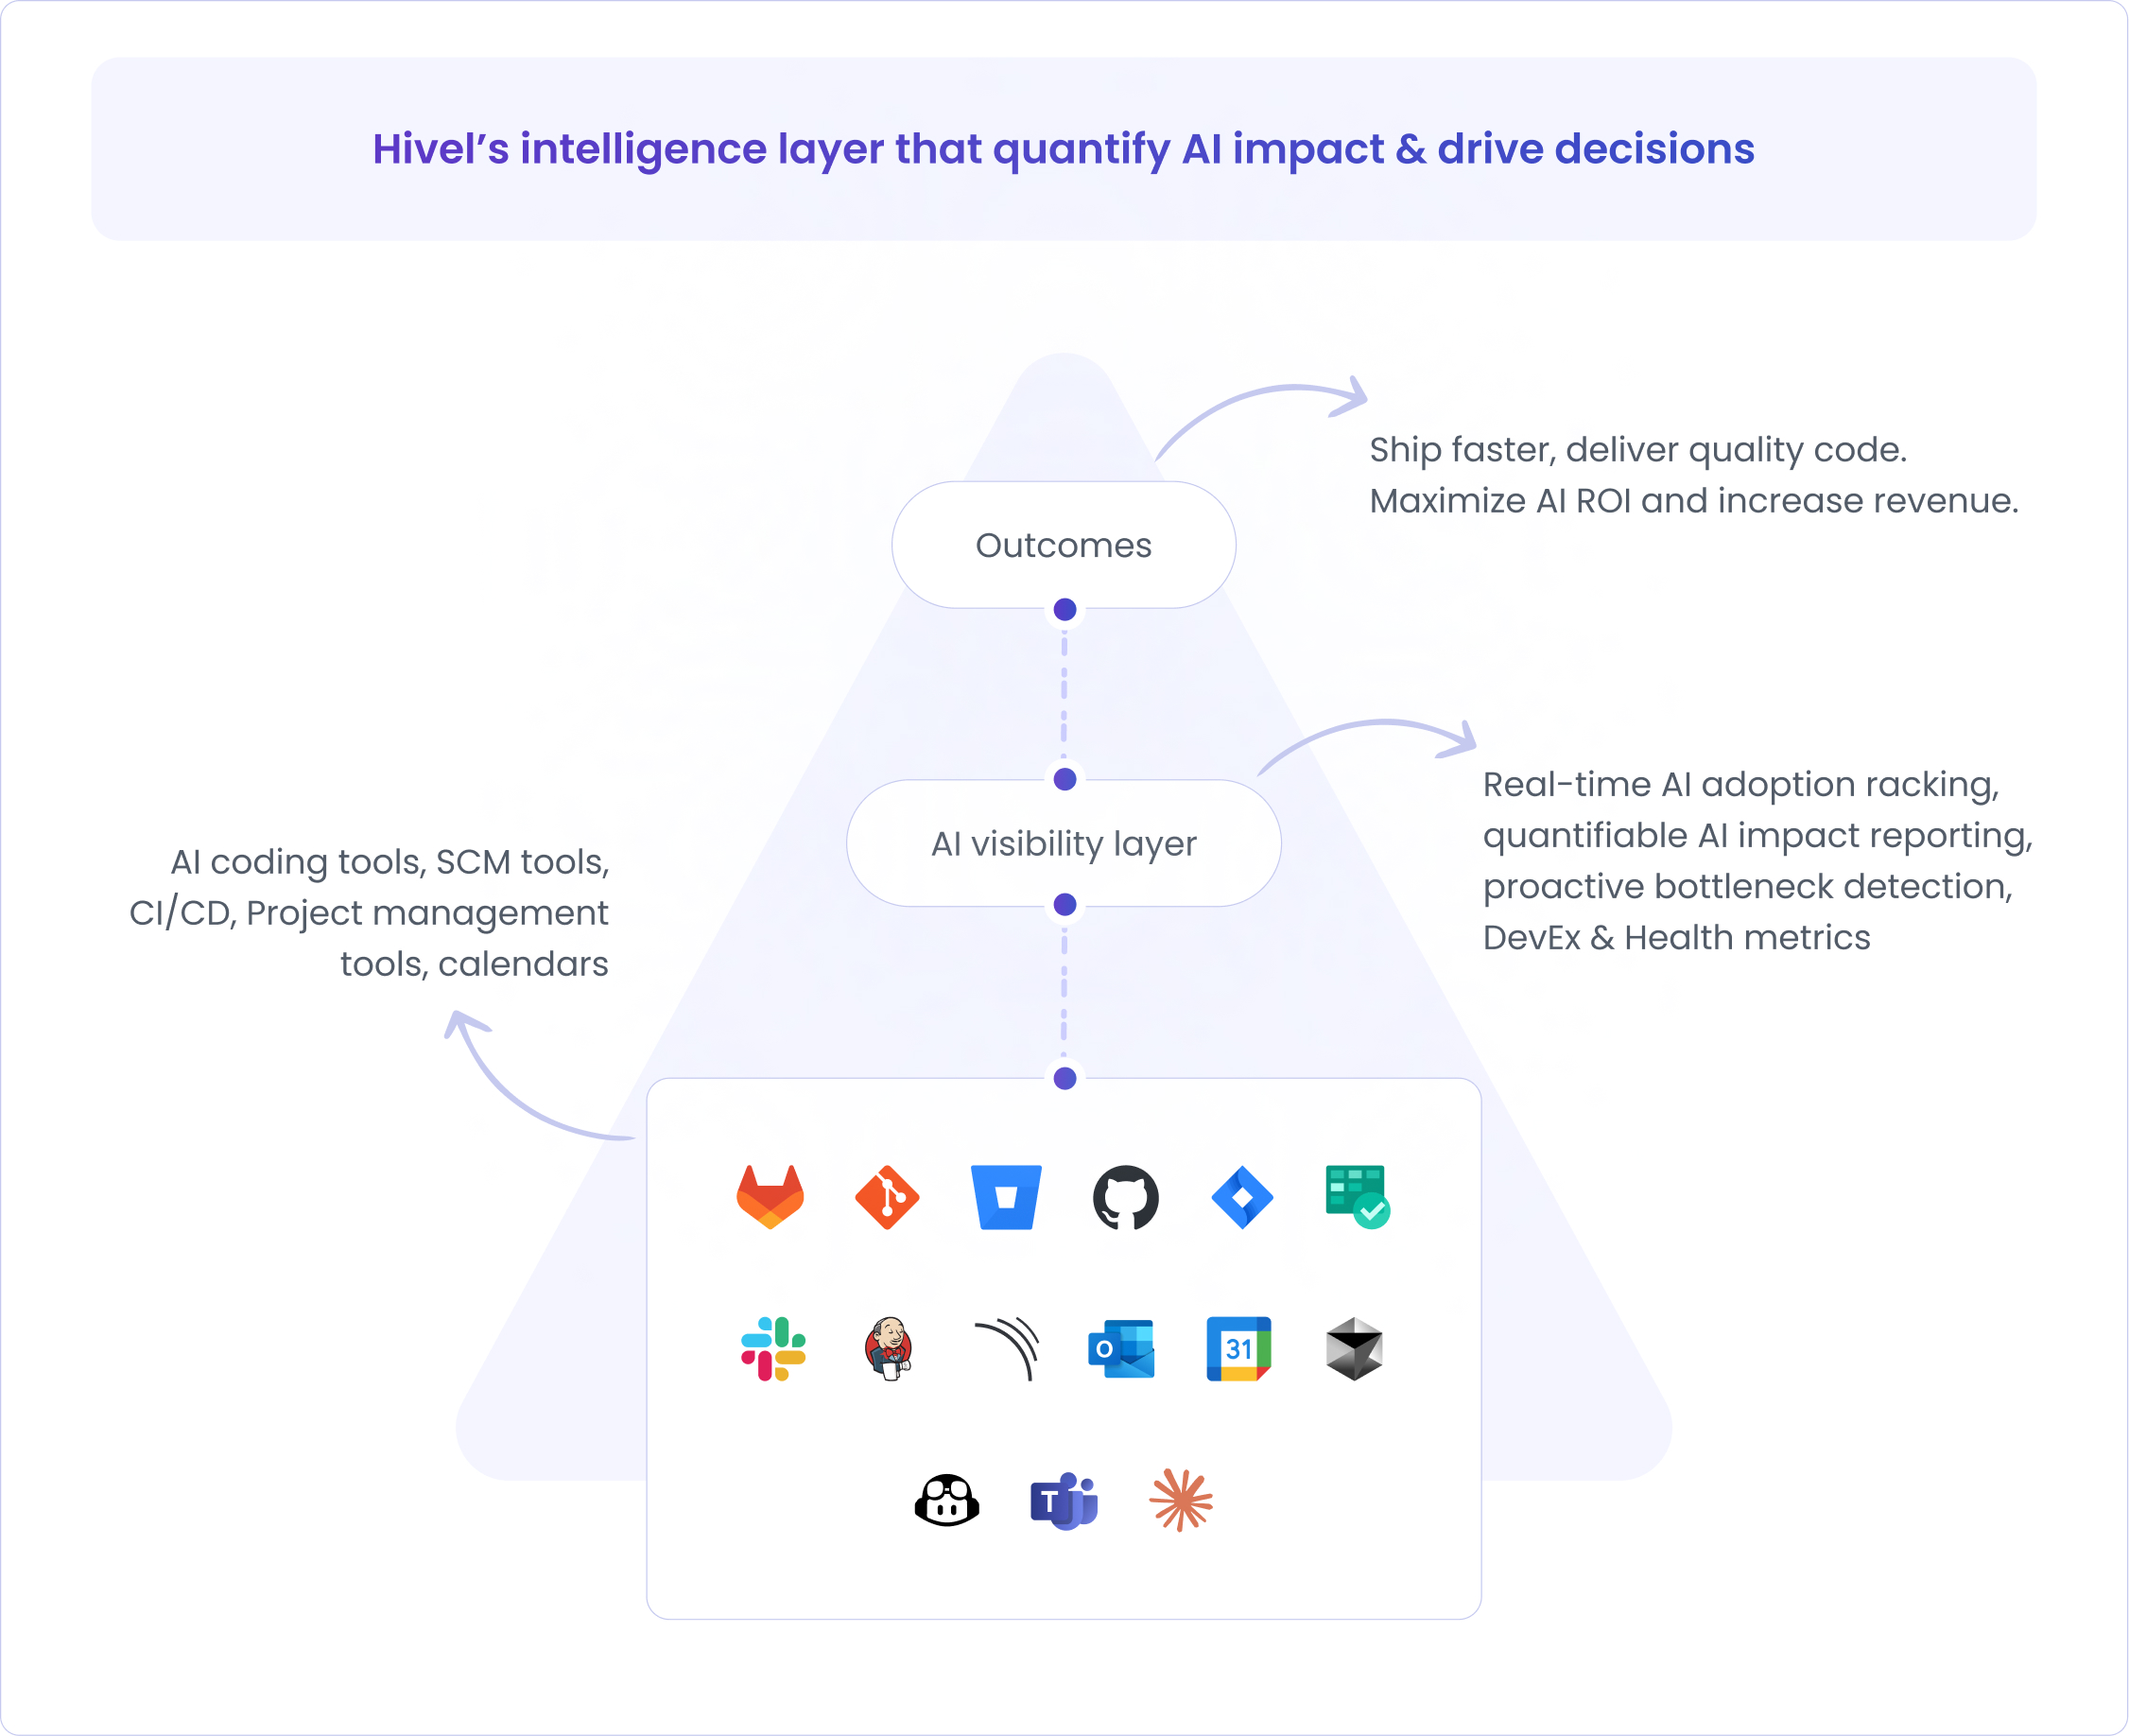
While LinearB focuses on developer activity and accepted AI suggestions, Hivel focuses on a different question: How much AI-generated code actually reaches production, and what impact does it have on speed and quality?
This empowers engineering leaders to move conversations from AI usage to AI ROI!

Key strengths:
- Measures AI-generated code that ships to production and correlates its underlying impact on speed, quality, and throughput metrics
- Board-level reporting for AI ROI and engineering outcomes
- Real-time insights into bottlenecks and delivery performance
- An AI-powered insights agent that lets leaders ask questions in natural language and get answers instantly
- Time-to-value within 48 hours, with rapid setup and quick visibility into the engineering pipeline and AI impact
- Native integrations with tools like GitHub, GitLab, Jira, and Slack
- Map engineering time across roadmap, tech debt, and KTLO for business alignment
Why do engineering leaders choose Hivel?
- A leader in Accounts Payable Automation for mid-market finance teams, AvidXchange, used Hivel to unify engineering data, shorten delivery cycles, build a culture of continuous improvement, and achieved 56% faster cycle times. (Read full case study)
- A leading oil and gas software company - W Energy - leverages Hivel to tighten its PR lifecycle, align review practices with delivery objectives, and drive engineering excellence. 40% higher throughput is one of the key outcomes. (Read full case study)
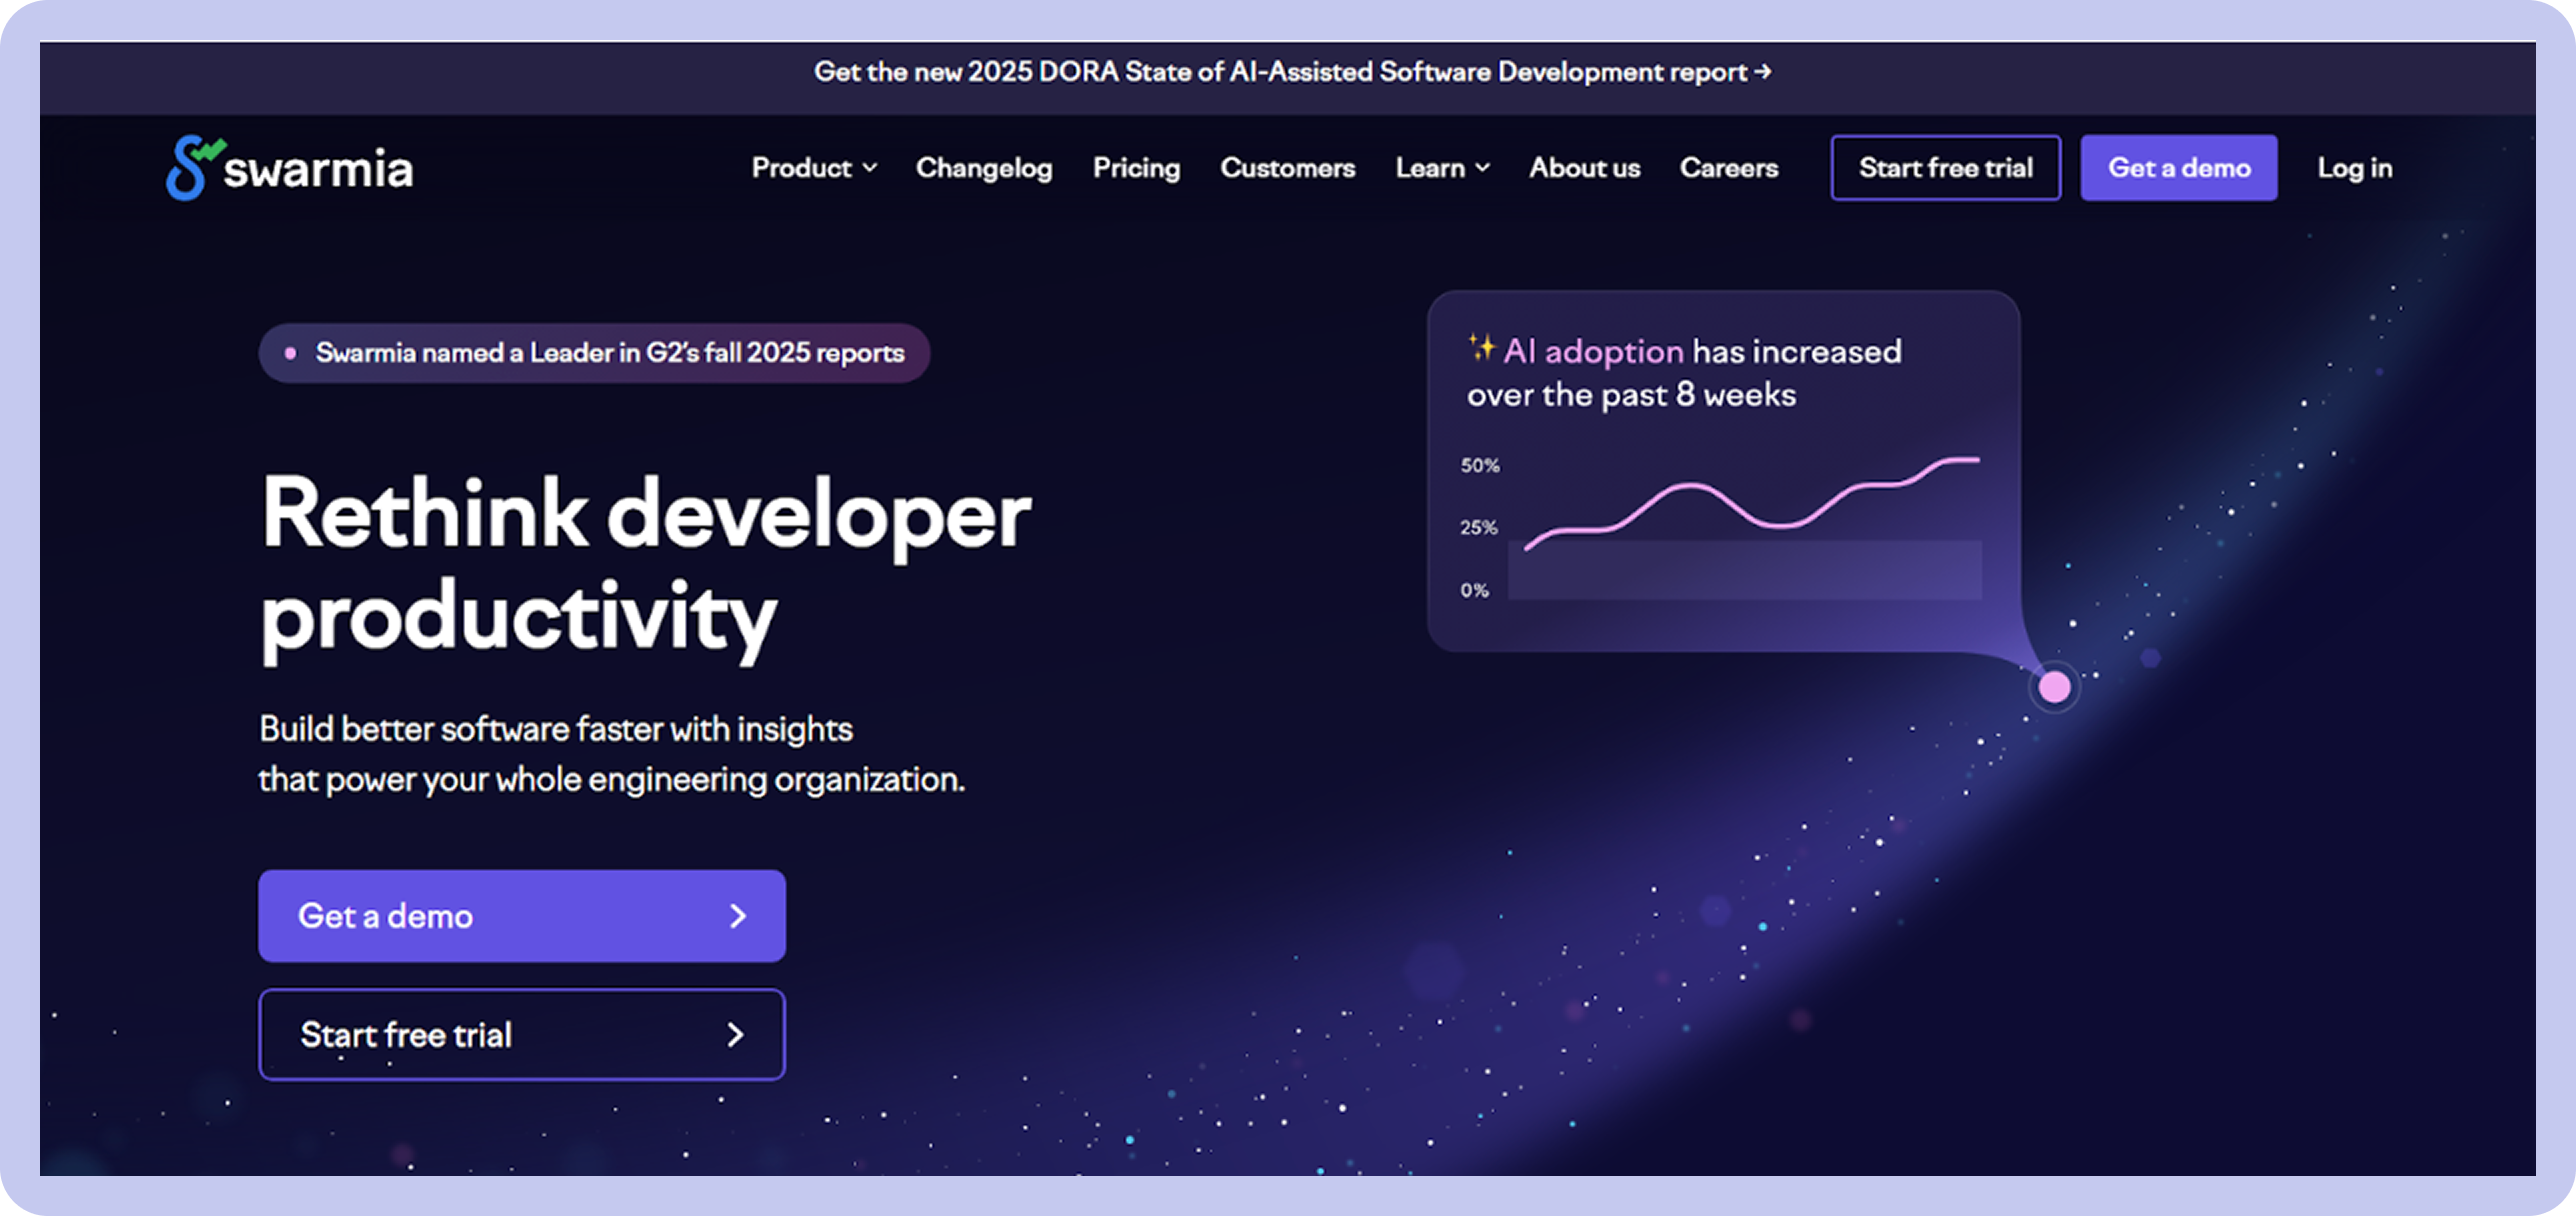
4. Swarmia
Best for:
Teams that want actionable workflow insights and strong developer experience signals without comprehensive executive planning features.
Overview:
Swarmia is an engineering effectiveness platform founded in Helsinki in 2019, primarily focused on developer experience and actionable workflow insights. Using it, teams can have insights into how work moves through the development process and where bottlenecks occur.
Swarmia gives engineering leaders, managers, and teams visibility across three areas: business outcomes, developer productivity, and developer experience.
Unlike other tools, Swarmia does not heavily focus on executive planning or financial alignment; rather, it is designed to help engineering teams improve daily workflow health. Swarmia also surfaces how unplanned work, bugs, and scope creep impact team plans.
Swarmia integrates with Git providers and issue trackers to create a unified view of engineering work.
Key strengths:
- Flow and cycle time analytics based on industry-standard metrics
- Teams set and track their own improvement commitments
- Real-time pull request insights to detect review delays and workflow bottlenecks
- Developer experience surveys to capture qualitative team feedback
- Work-in-progress and workload visibility across teams
- Team-level actionable insights instead of only executive dashboards
- Developer-first design philosophy - explicitly non-surveillance, data visible to contributors themselves
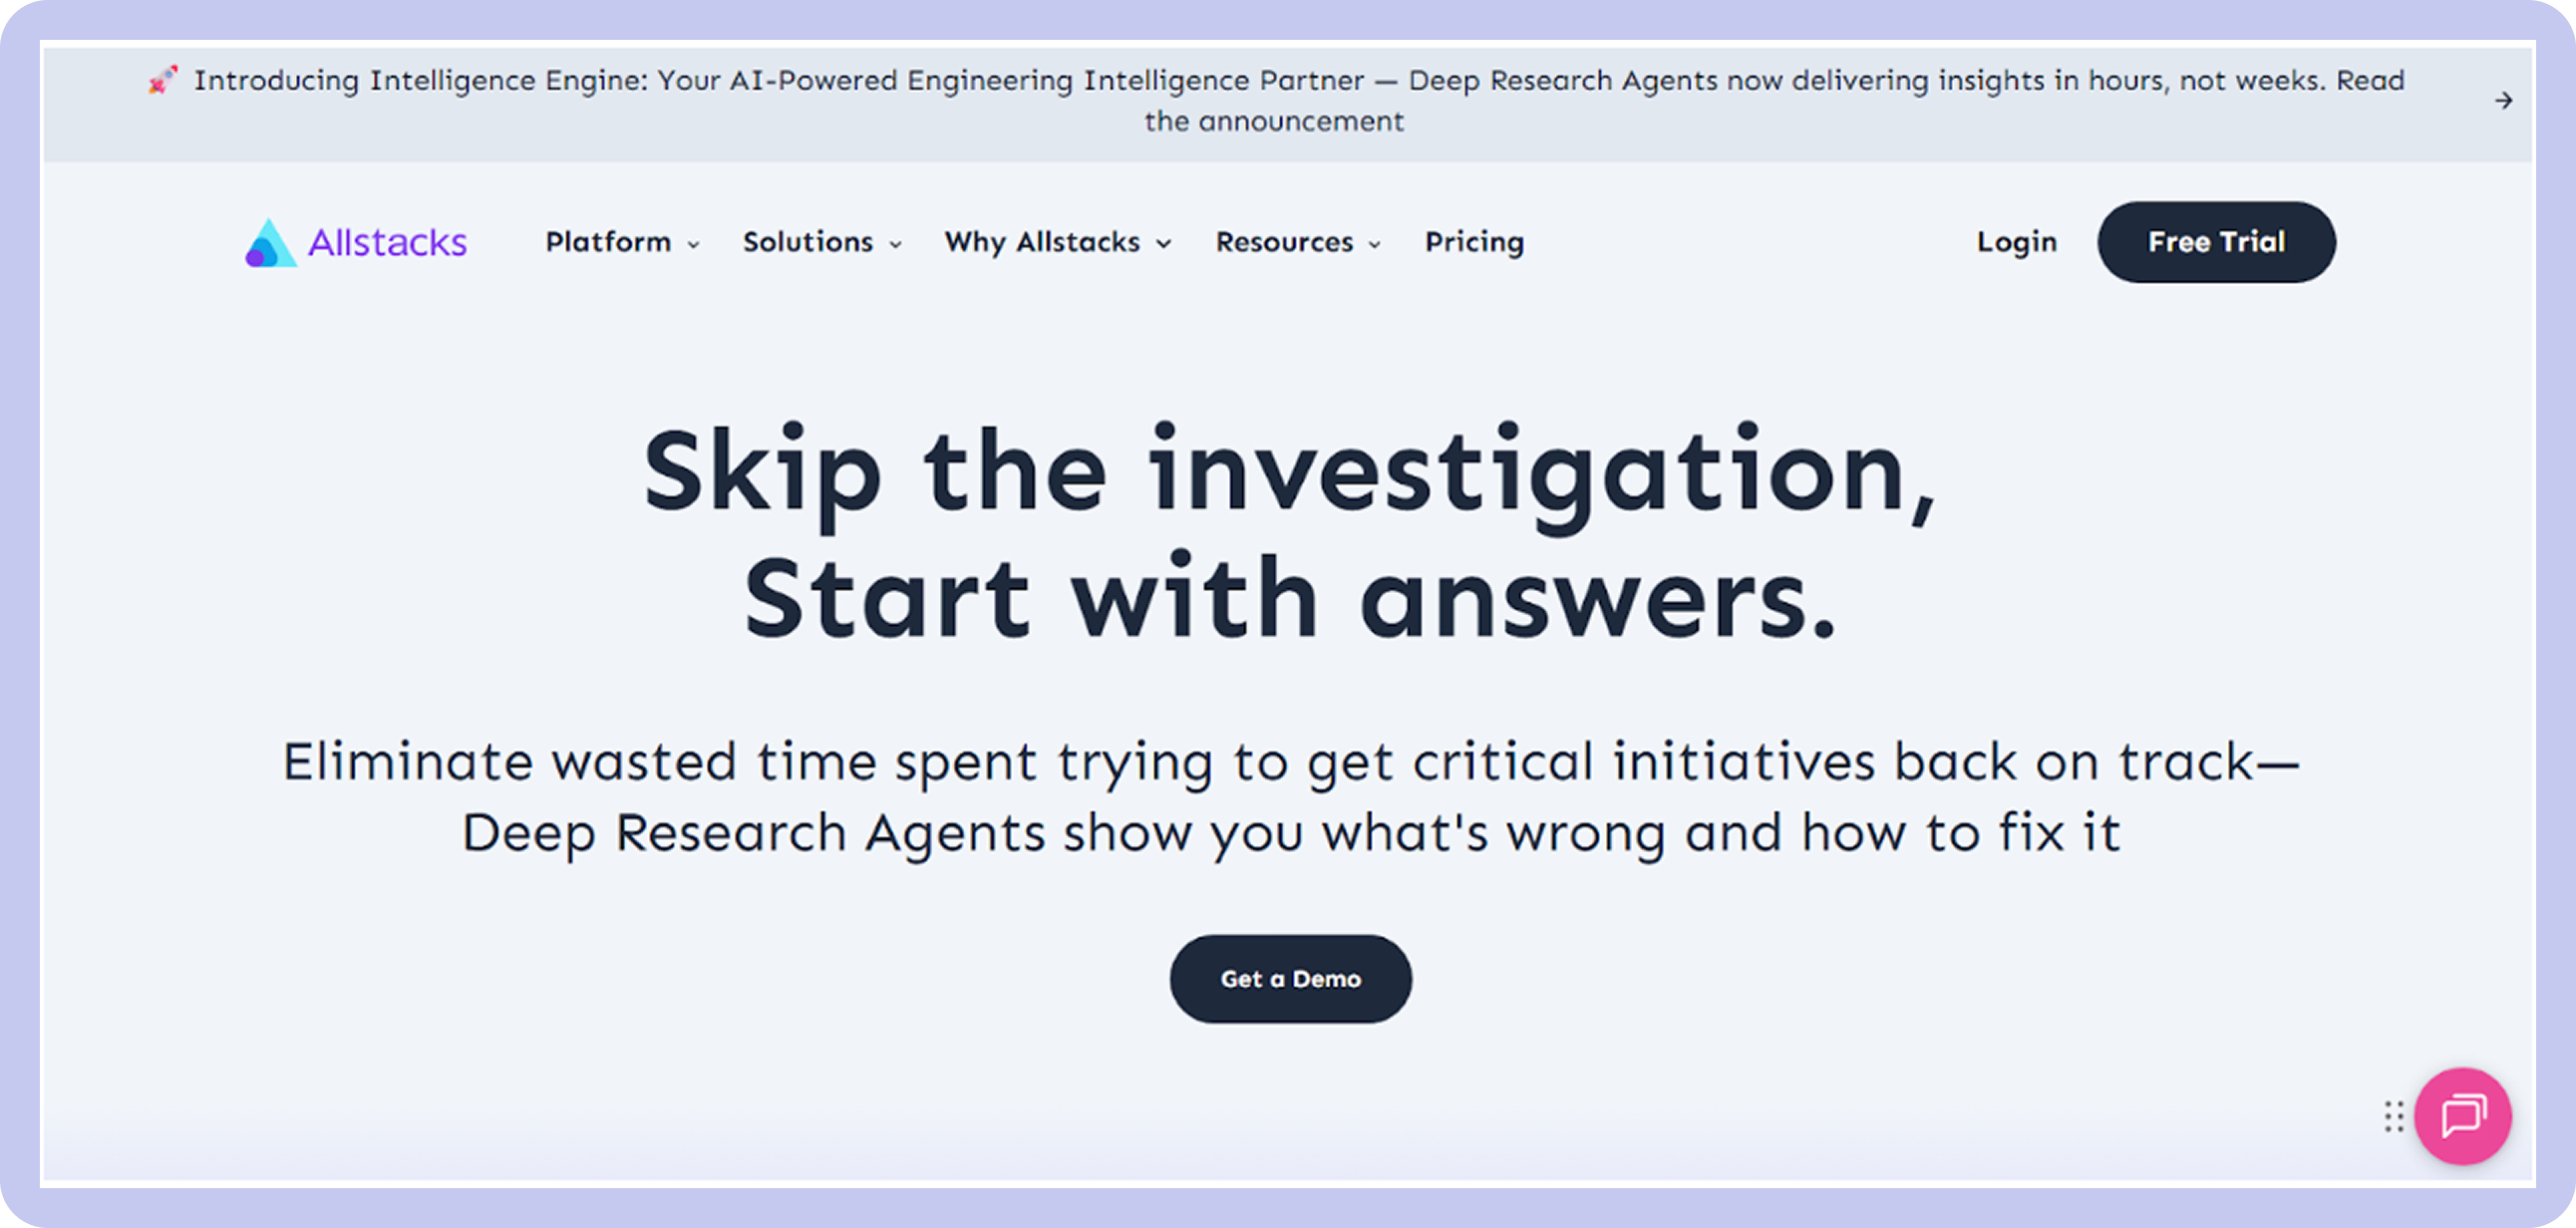
5. Allstacks
Best for:
Organizations that want predictive delivery insights and risk forecasting.
Overview:
Allstacks is an engineering intelligence platform, offering crucial insights into delivery forecasting, risk detection, and outcome prediction.
To do so, it aggregates data from version control, issue trackers, and CI/CD tools and offers a clear picture of how work is progressing and where delivery risks may appear.
Founded in 2017, it has evolved from a predictive delivery tool into what it now calls an AI-native engineering intelligence platform.
While LinearB prioritizes flow metrics and PR-level automation, Allstacks is more inclined toward predictive analytics and portfolio-level insights.
Key strengths:
- Predictive delivery forecasting using ML models across the full SDLC
- AI-native deep research that surfaces risk drivers and actionable recommendations on demand
- Map engineering work to business OKRs, not just delivery pipelines
- Track GitHub Copilot adoption, usage, and impact at the contributor level
6. Hatica
Best for:
Teams that want a balance of engineering analytics, developer experience insights, and AI-driven recommendations.
Overview:
Hatica is an engineering analytics platform designed to give teams a unified view of productivity, workflow health, and developer experience. Hatica is explicitly built on the SPACE developer productivity framework.
It integrates and combines data from Git, issue trackers, CI/CD, and communication tools to provide insights across the entire engineering lifecycle.
Hatica positions itself as a team-centric analytics platform. Compared to LinearB, Hatica offers a broader mix of productivity insights, developer signals, and AI-powered recommendations.
Key strengths:
- DORA and flow metrics with detailed cycle time analysis
- Developer experience insights, including workload, collaboration, and focus time
- AI-powered recommendations to identify and resolve workflow bottlenecks
- Team and organization-level dashboards for different leadership roles
- Customizable reports for engineering and executive stakeholders
- Free-forever plan available - low barrier to evaluation
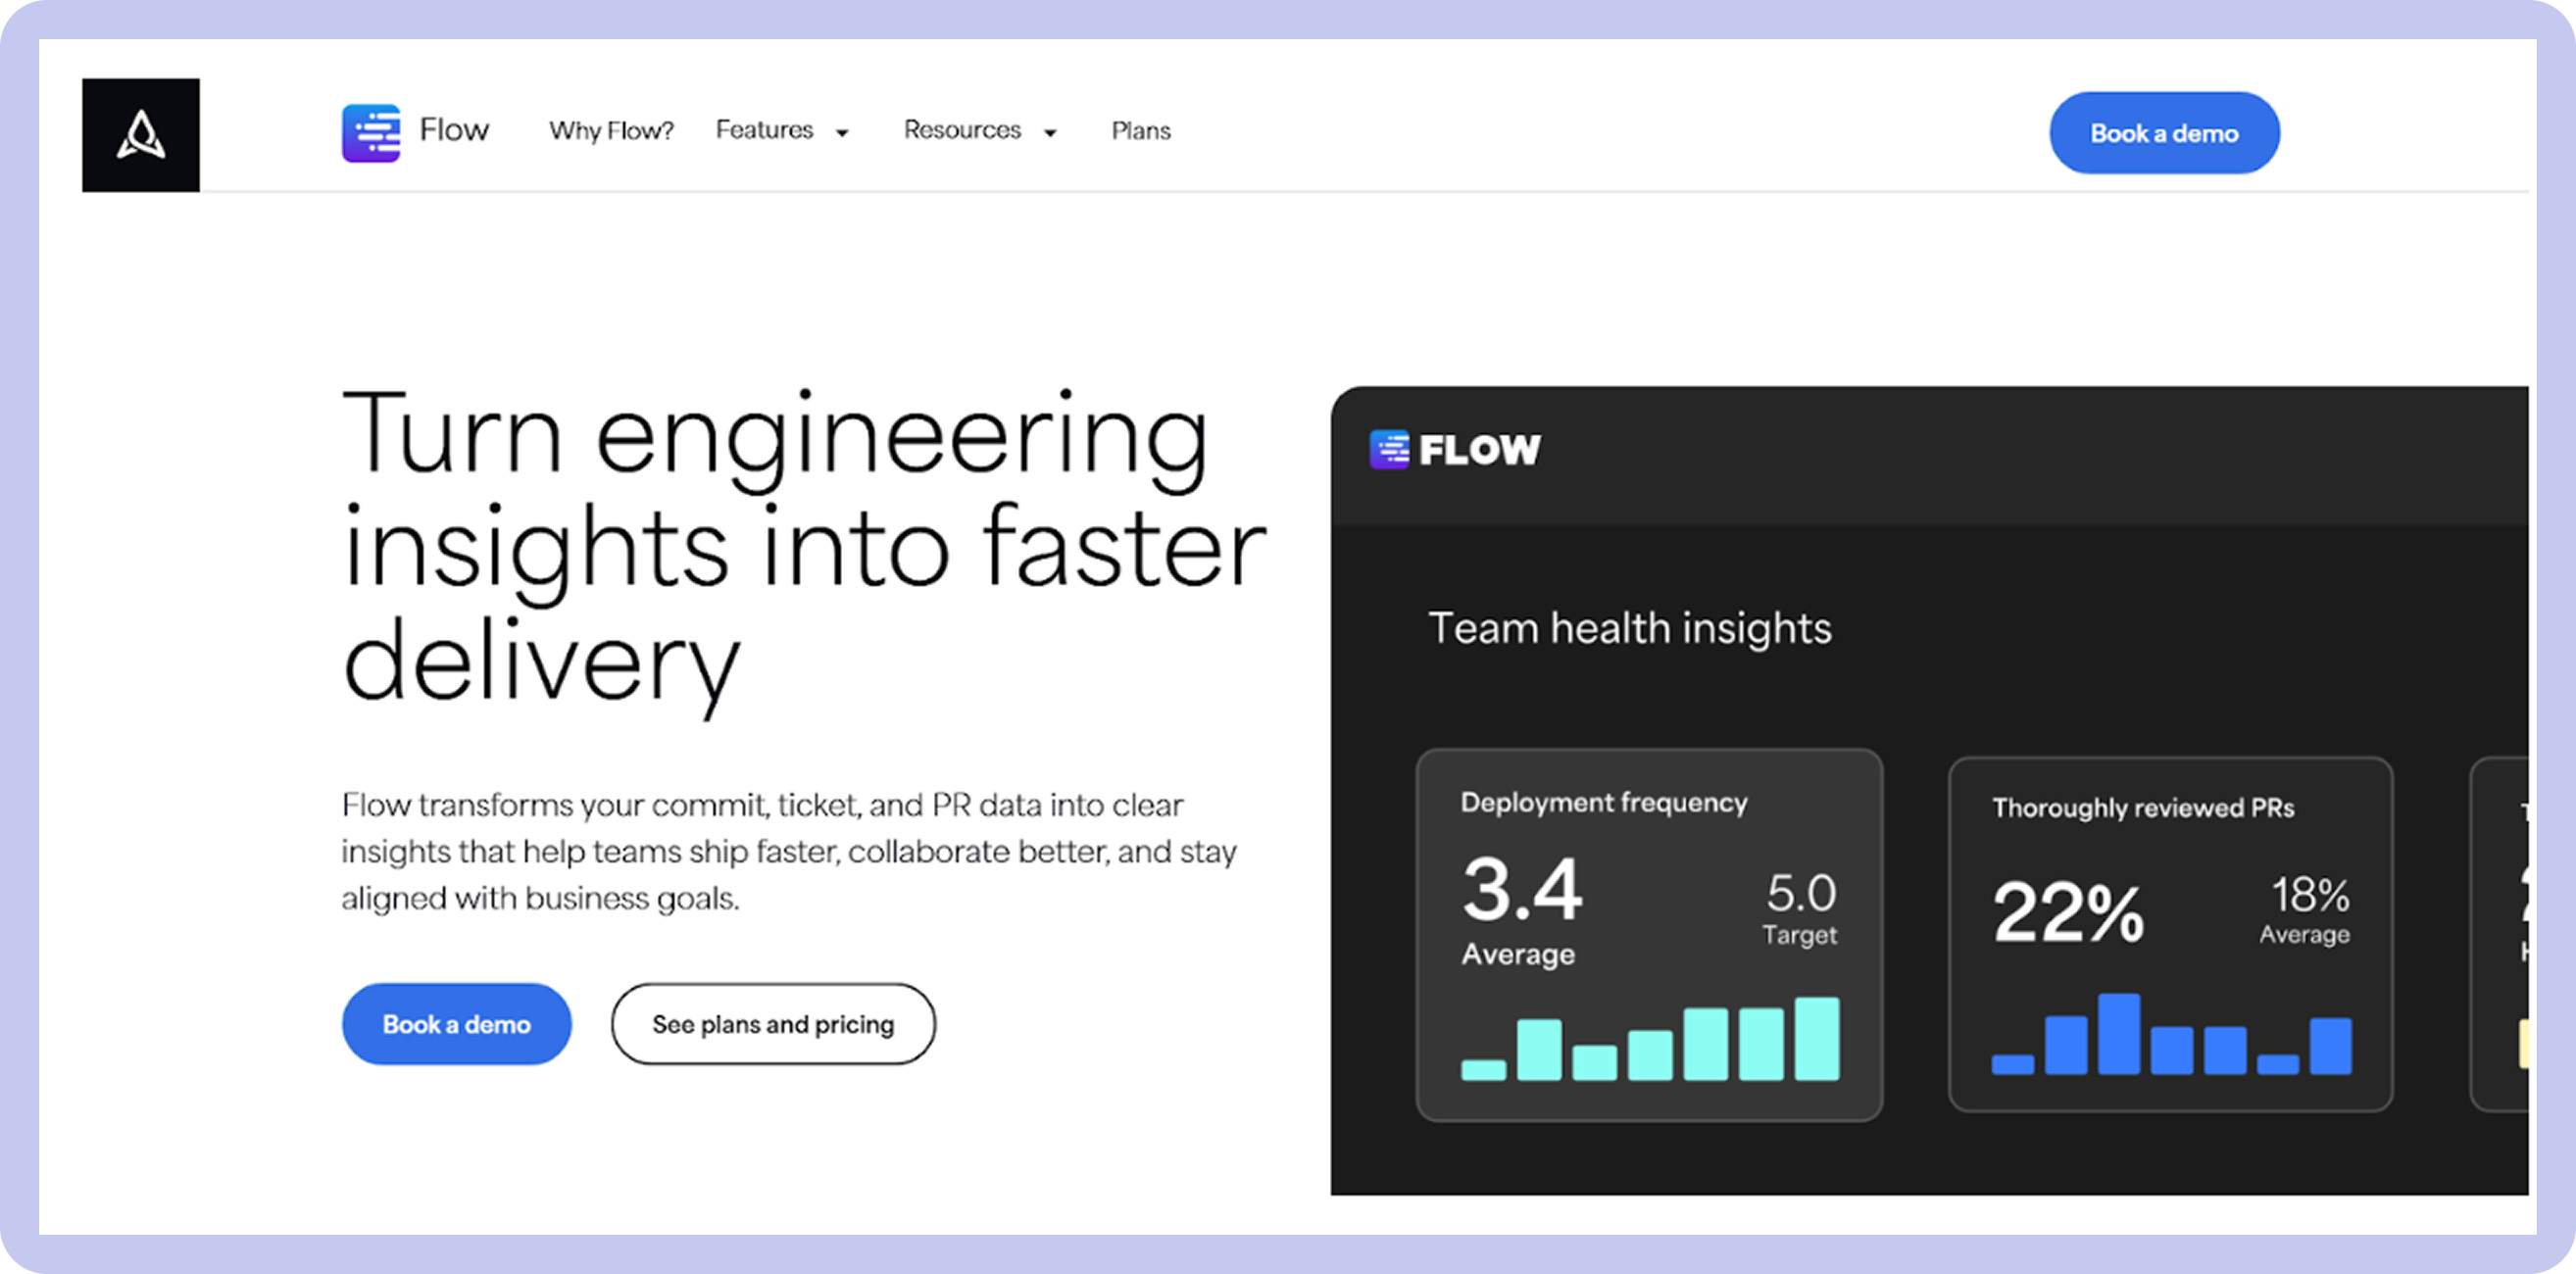
7. Pluralsight Flow (acquired by Appfire and rebranded as Flow)
Best for:
Organizations that want mature, flow-based engineering metrics with strong historical benchmarking.
Overview:
Pluralsight Flow (originally founded as GitPrime in 2016, acquired by Pluralsight in 2019 for $170M, and most recently acquired by Appfire in January 2025) is one of the earlier engineering analytics platforms focused on flow metrics, coding patterns, and delivery trends. It helps teams get an idea of how work moves through the development lifecycle and where delays occur.
It provides insights into like cycle time, review patterns, and coding activity, with a strong emphasis on historical trends and benchmarking. Compared to LinearB, Pluralsight Flow offers a similar focus on flow metrics. However, it is mainly used by organizations that want long-term productivity tracking and benchmarking, instead of quick AI insights and automation.
Key strengths:
- Flow-based metrics, including cycle time, review time, and coding trends
- Historical benchmarking across teams and time periods
- Developer activity insights from version control data
- Mature platform with a long presence in the engineering analytics space
8. Minware
Best for:
Mature engineering organizations that want flexible, customizable analytics instead of pre-defined dashboards.
Overview:
Minware is a software development observability platform that works like a flexible engineering data warehouse with a built-in BI layer. The idea of Minware is simple - instead of giving teams a fixed set of delivery metrics, allow them access and combine data from Git, ticketing, and CI/CD systems in a highly customizable way.
While LinearB provides pre-defined engineering metrics out of the box, Minware allows teams to define and query the priority metrics using its proprietary minQL query language.
Key strengths:
- Engineering data warehouse approach with flexible analytics
- Custom metric definitions using minQL query language
- Deep analysis of flow efficiency, cycle time, and work allocation
- Built-in BI layer without needing a separate data engineering setup
- Designed for complex, mature engineering organizations
Conclusion: How AI is Changing Engineering Intelligence Tools and How Does it Impact Engineering Teams
2026 is fundamentally different. The right questions now are - Are we building the right things, with the right people, with the right tools - and can we prove it to the board?
That's not a measurement question. That's an intelligence question. And it requires a different category of tool.
AI is not just changing how developers work. But it also changes what leaders need to know.
The engineering intelligence tools that will define the next five years aren't the ones that measure AI adoption.
They're the ones that measure AI outcomes - the code that ships, the debt it creates, the throughput it genuinely improves, and the ROI a CFO can put in a quarterly report.
FAQs
1) What should you look for in a LinearB alternative?
Modern engineering intelligence tools should offer:
- System-level throughput, not just team activity
- AI impact measurement, not just AI usage
- Developer experience signals
- Real-time workflow visibility
- Predictive and forward-looking insights
- Flexible and deep integrations
- Clear executive translation
2) What are the main limitations of LinearB for modern teams?
Some teams find LinearB inadequate when they use deeper AI impact tracking, predictive delivery insights, and executive-level ROI reporting. Though it provides strong flow and DORA metrics, engineering teams with evolving AI-heavy engineering practices may look for tools that connect engineering work more directly to business or AI outcomes.
3) Are LinearB alternatives harder to adopt?
Adoption complexity that defines time-to-value varies by tool. Tools like Hivel offer quick setup with pre-built dashboards that realize time-to-value within 48 hours, while others provide more flexible or customizable analytics that may require deeper configuration.
4) Which LinearB alternative is best for your team?
The right choice depends on your primary goal:
- AI-first engineering outcomes: Hivel
- Business alignment and planning: Jellyfish, Allstacks
- Developer experience focus: DX, Hatica
- Flow and workflow analytics: Swarmia, Pluralsight Flow
- Custom engineering data and analytics: Minware
5) How is engineering intelligence different from developer analytics?
Developer analytics often focuses on activity-level signals such as commits or pull requests. Whereas engineering intelligence platforms go the extra mile by analyzing system-level throughput, delivery risk, and business alignment.