This is the John Snow Water Pump, still in place at the intersection of Broadwick Street and Lexington Street in Soho, London.

During the 1850s, contaminated water from this pump caused a cholera epidemic.
Unaware of cause and source, the city council tracked deaths, mapped outbreaks, and kept detailed records.
But unfortunately, the data was rich. Insight wasn’t.
And that led them to believe cholera spread through bad air!
Then came John Snow, who mapped data points to the Broad Street water pump, and the real cause surfaced. He connected events to outcomes, and everything changed.
The modern engineering teams are waiting for that ‘John Snow’ moment. Teams have AI suggestions (the data), but no linkage to KPIs (the insight).
And thanks to this, everyone argues over impact based on belief and not evidence.
Until we connect AI signals to real engineering outcomes, we can’t answer the one question leaders care about: “Is AI actually moving our KPIs?”
So, considering the gravity of the situation, let’s talk today about connecting AI suggestions to real-world engineering KPIs.
The Gravity Problem with AI Suggestions
Gravity is something that makes motion meaningful. Without it, objects lose speed and direction, drift aimlessly, and everything would eventually fall apart.
In engineering, even modern teams operate in an orbit with no gravitational force binding AI suggestions to real-world engineering KPIs such as cycle time, quality, throughput, and stability.
Without that pull effect…
- Regardless of suggestions being accepted or rejected, no one would ever be able to know if they speed up the PR, cut cognitive load, or minimize context switching.
- AI noise grows indefinitely. You see more suggestions, more edits, more activities, but no change in cycle time, rework, or throughput.
- Losing interest in AI adoption would become a real fear. Because,
more AI hints → more noise → less attention → weaker adoption over time.
- Leaders lose confidence. They see activity spikes but zero movement in KPIs.
But the question is, why do most AI-SDLC setups lack that gravity, lack that pull effect?
- It shows inline suggestions in the IDE, but doesn’t link them to analytics or key metrics.
- It lacks insight into what happens after those suggestions get accepted or rejected. Does rework drop? Does the defect rate improve? Does cycle time shorten?
- It does not connect across tools - Git, CI/CD, project management, and issue tracking.
So, there is no end-to-end visibility possible bundled with context-rich insights.
In essence, AI suggestions keep moving, but nothing pulls them into metrics that matter the most. And that’s the gravity problem with AI suggestions!
The Hidden Link: How Every AI Suggestion Touches a KPI?
Most modern engineering teams consume AI suggestions as small helpers in the editor.
Faster typing. Cleaner patterns and ready-made snippets.
But even a small AI suggestion changes how work flows through your system. It affects far beyond how fast code gets written - into something crucial like defect density, edge cases, rework, stability, etc.
Measuring it or not - is up to you. But that link is always there.
The following is how AI suggestions ripple into core engineering KPIs.
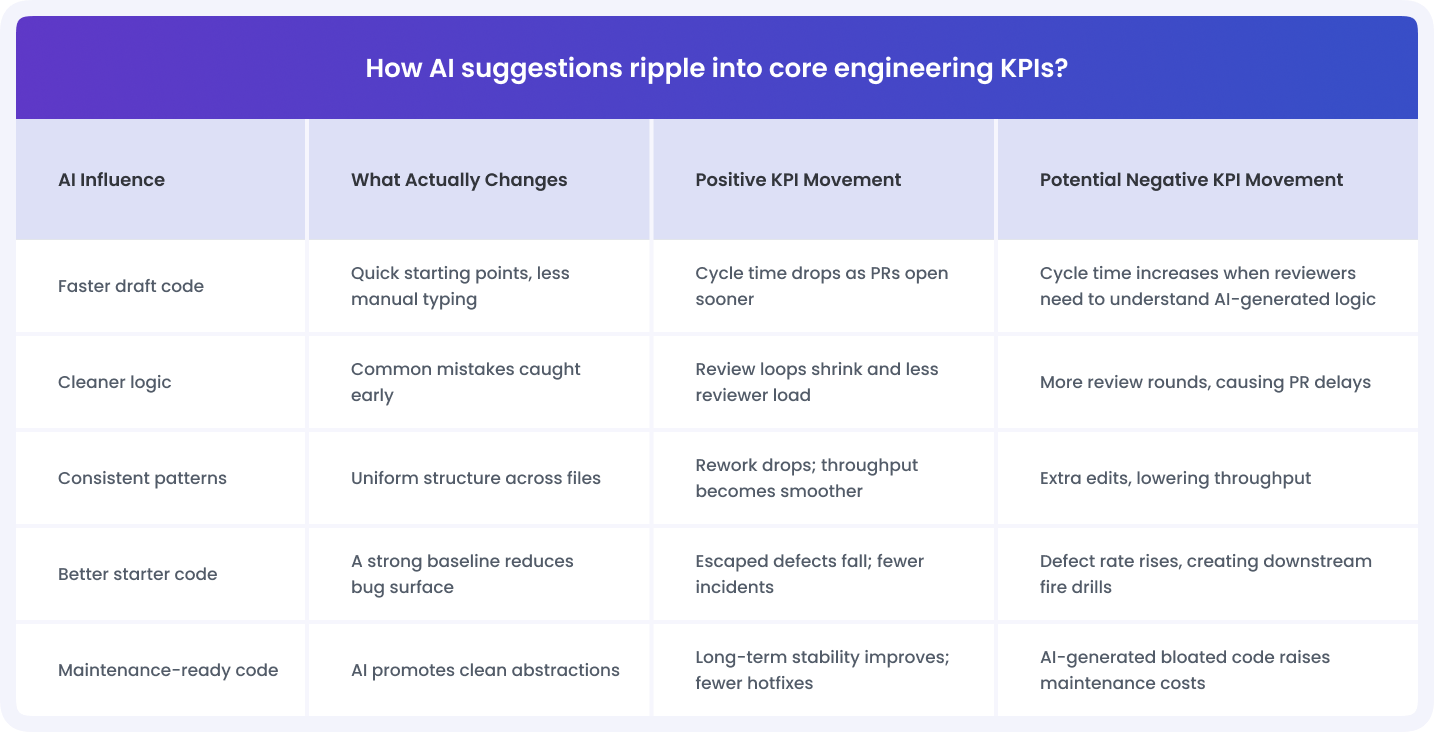
With this, it becomes clear that AI suggestions are not neutral. They can lift engineering KPIs or drag them.
How you measure these ripples and learn which patterns help and which ones hurt makes a whole lot of difference!
Download AI Impact Guide. Measure the ROI of AI in SDLC Through Outcomes
The Framework - Connecting AI Suggestions to Real-World Engineering KPIs (In John Snow Style)
John Snow didn’t guess the cause of cholera.
He followed a sequence - capture → map → link → compare → attribute.
The same logic is enough to connect AI suggestions to real-world engineering KPIs.
#1: Capture the Signal (John Snow: plot every death point)
John Snow walked every street and captured every data point. For him, no detail was too small.
In engineering, the same rule holds.
You must capture every AI suggestion, every acceptance, every rejection, and every repo touched.
Because, without capturing the points, it is impossible to see the pattern.
#2: Map the Activity (John Snow: draw the map and reveal the cluster)
John Snow did not stop at data collection. He mapped the cases onto the city streets.
AI suggestions need the same treatment. Map them across, repos & services, modules & critical code paths, high-churn files, code reviews, CI/CD, past hotspots, and developer/team segments.
This will reveal where AI is influencing your system.
#3. Link to Outcomes (John Snow: connect the cluster to the water source)
John Snow drew the line between the cluster and the cause. He did not say “there are many deaths here”. He instead showed why they appeared there.
In engineering, the same “why” is missing. So you link suggestions to real events, such as…
- PR creation speed
- Review loops
- Merge delays
- CI failures
- Defect creation or prevention
- Rework load
This is where the patterns gain meaning.
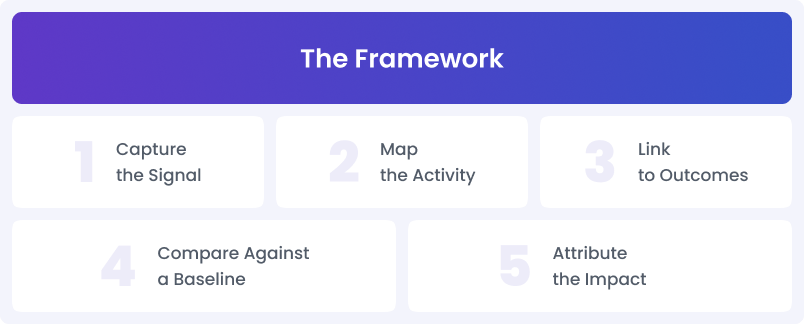
#4: Compare Against a Baseline (John Snow: compare houses that used the pump vs. those that didn’t)
John Snow verified his claim by comparing groups - people who drank from the pump vs. people who didn’t.
You do the same by comparing…
- Before-AI vs. after-AI cycle time
- Modules with heavy AI influence vs. modules without
- Teams that adopt AI vs. teams that give cold shoulders to AI
This comparison eliminates guesswork and introduces real movement.
#5: Attribute the Impact (John Snow: close the pump and watch cases fall)
When the Broad Street pump handle was removed, the cases dropped. That was the final proof - attribution.
In engineering, attribution happens when you can say…
- AI suggestions reduced rework in this module.
- AI increased review loops for junior devs.
- AI-driven patterns cut defects by 20% in critical services.
This is where AI suggestions turn from theory into evidence.
How to Instrument Analytics the Right Way
Tracking AI usage is not analytics. The true analytics is connecting AI usage at the system level with key metrics where the impact actually happens.
Here’s what “doing it right” looks like.
#1. Track the Full Journey
AI suggestions feel small. But it runs through the entire system:
Writing →Review → Merge → CI → Production.
So your instrumentation must follow the full trail:
- Suggestion accepted or rejected
- PR created
- Review loops
- Merge
- CI results
- Rework
- Defects
- Incidents
#2. Capture AI Impact at the Repo and Module Level
AI impact is uneven and unpredictable. Some repos benefit. Some teams struggle. Some modules become healthier. Some become unstable.
Instrumentation must zoom in:
- High-churn files
- Critical paths
- Legacy services
- Modules tied to incidents
- Areas with heavy developer rotation
#3: Watch the “Micro-Shifts”
KPIs don’t jump overnight. They shift in small signals first.
These small signals matter…
- Smaller PRs
- Fewer conditional branches
- Fewer review comments
- Fewer back-and-forth loops
- More consistent naming
- Fewer CI red builds
- Smaller rework patches
#4: Compare AI Work With Non-AI Work
If everything is blended, nothing is clear. You need separation. Thus, compare cycle time, rework, CI failures, and defect creation between the two groups.
Why Hivel is the Right Way to Instrument AI Adoption and Impact Analytics
The biggest problem in instrumenting analytics is that you don’t have one system that can see the whole path - AI suggestions in the IDE → changes in code review → commits in Git → signals in CI/CD → outcomes after merge.
That’s the missing layer Hivel fills.
Hivel is an AI-powered Software Engineering Analytics platform.
It captures every AI-influenced change, stitches it across repos, PRs, pipelines, issues, and incidents, and offers contextually rich insights into how those small suggestions move (or fail to move) your core engineering KPIs.
Hivel makes you see AI not as a coding or review shortcut but something more crucial, which can either make or break your engineering KPIs. It makes AI (and people) KPI-aware!
With Hivel’s Intelligence layer active in your AI-SDLC, you can finally see how AI suggestions move the KPIs that matter, such as…
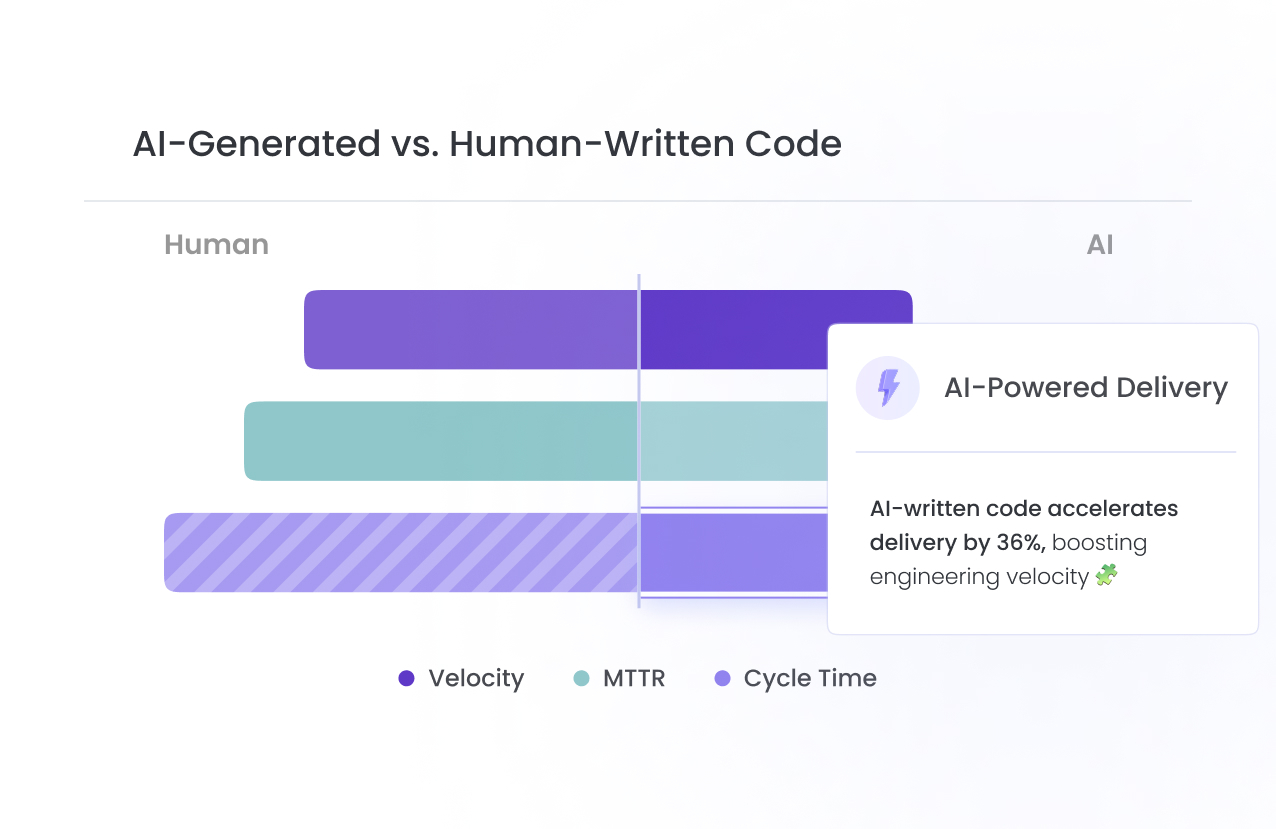
- Cycle Time - Did AI help teams open and close PRs faster?
- Review Time - Did it reduce back-and-forth or increase reviewer load?
- Rework Rate - Did AI prevent later fixes?
- Defect Density - Did AI improve logic quality or introduce hidden issues?
- Throughput - Did teams ship more stable work per sprint?
- Stability & Incident Load - Did AI reduce post-merge bugs or trigger more hotfixes?
.png)
FAQs
1. What metrics connect AI suggestions to business outcomes?
AI suggestions connect to business outcomes through the engineering metrics they influence. The following are the most common ones…
- Cycle Time - AI suggestions speed up coding and reduce mistakes, so PRs open and merge faster.
- Review Time - AI produces cleaner diffs, which reduces review comments and cuts back-and-forth loops.
- Rework Rate - AI catches weak patterns early, which lowers post-merge cleanup and stabilizing sprints.
- Defect Density - AI flags risky logic and missing checks, reducing bugs and incident load.
- Throughput - AI eliminates friction across coding and review that helps teams ship more work consistently.
- Stability & Incidents - AI strengthens fragile code paths, leading to fewer regressions and production issues.
2. How do you track suggestion acceptance and impact?
Tracking AI suggestions needs visibility across the whole SDLC. To do so, you would need to capture every suggestion, link that change to PR, follow it through CI/CD, measure rework after merge, check defect creation, and compare AI-influenced work vs. non-AI work. With Hivel, you can track this full chain automatically, without managing any heavy engineering or workflows.
3. Can AI suggestions slow the team down?
It happens. AI can increase review loops, add complexity, or push patterns that don’t fit your system. The key is not to guess, but rather, measure it. Adopting AI without putting any code governance system in place and not training teams on AI-human synergy are the two main reasons behind AI introducing friction to SDLC, instead of streamlining it. Hivel helps you to track areas where AI is not helping your team, so that you can take data-driven actions and turn the tables.