Why Most Engineering OKRs Fail to Drive Value in AI-SDLC
The current problem with OKRs (yes, it has a problem!) lies within its history. So, it’s worth visiting the history of OKRs.
In the 1950s, Austrian-American consultant and educator Peter Drucker pushed the idea of “management by objectives.”
Though it sounded great - Set goals. Communicate them. Get people aligned & worked on it - it lacked a way to measure real progress in real time.
In the 1970s, Andy Grove - first hire after Robert Noyce and Gordon Moore founded Intel in 1968 - saw that gap. Intel was building chips using techniques like X-ray lithography, where even small errors could lead to huge losses. Andy realized that he could not run a team on vague goals. He would need clear objectives and hard numbers that he could trust. So he added “Key Results.” This move made the whole system more real, measurable, and outcome-focused.
John Doerr - a young Intel engineer-turned-salesperson at Intel - learnt the OKRs system from Andy Grove’s OKRs class, and later, when he became a VC, he carried that learning with him.
That’s how OKRs reached Google in 1999, and the rest is history.
But here’s the problem, OKRs were built for a world where everything had its slow pace. Where teams used to work in a slower cycle. Where engineering complexity was nothing like it is today.
Today, engineering moves in real-time. AI-driven development, rapid releases, distributed teams, automated checks - everything shifts faster than quarterly planning cycles can capture.
But still, most teams use OKRs the way they used to be in the 1970s and 1990s. This creates a Comfort Trap. OKRs look perfect on the surface, but mean nothing contextually.
On surface - Our PR open rate is 98%.
Reality - But the reviews take four days, slowing every release.
On surface - PR throughput is up. AI helped us merge faster.
Reality - Review depth dropped. More issues reached production. MTTR went up.
We must admit this, OKRs hallucination is real.
Hitting numbers ≠ creating value
Shipping fast ≠ moving the product forward
Green OKRs ≠ real progress
But let’s not blame AI. AI doesn't break OKRs. AI simply exposes how poorly OKRs are tied to real engineering values in AI-SDLC.
The Engineering OKRs Alignment Issue
OKRs alignment sounds simple on paper - connect every team goal to the company goal, top-down and bottom-up.
But in reality, engineering OKRs alignment isn’t a straight line. It behaves more like a field - space between what the business wants, what the product imagines, and what engineers can deliver.
This space is what I call the Alignment Field. This field bends. It drags. It distorts. These are some of the factors that distort this field.
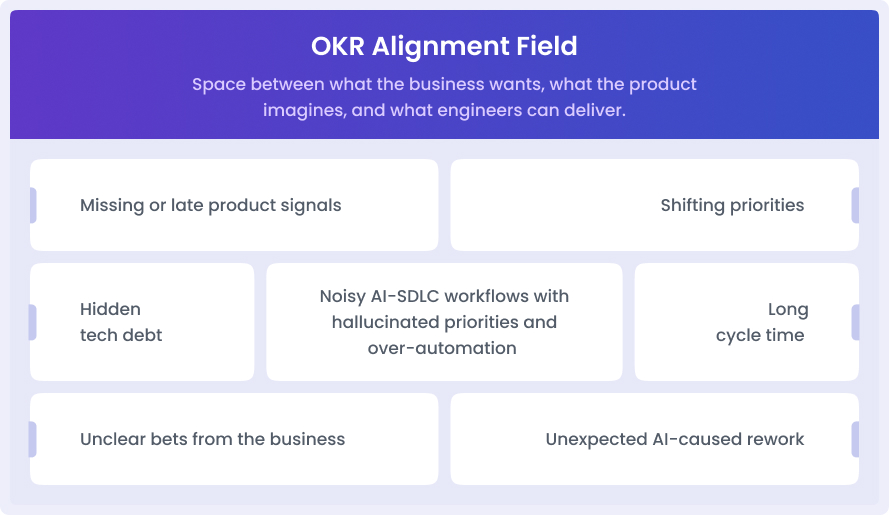
When these bad forces bend the field too much, OKRs start to act weird - looking good on paper but drifting away from real outcomes. That’s the true misalignment.
The same alignment issue surfaced in this Reddit discussion.
A team experimented with joint OKRs (same OKRs for engineers and product leadership) to keep engineers close to customer value (how much they would improve the value to customers).
However, soon, their product OKRs became business-heavy, and engineering OKRs vanished.
Both product and engineering OKRs made sense in isolation, but together, they got lost in the mist. In my words, they lost the alignment field.
This is the major problem most engineering teams face today. Top-down OKRs talk about outcomes. Bottom-up OKRs talk about limits.
In an AI-heavy SDLC, this gap widens even more and makes OKRs drift real. To avoid it, we must align bottom-up reality with top-down intent.
The Data Alignment Stack (A Fresh Way to Think About OKRs)
Most engineering OKRs drift because they are written without understanding how work moves through a team. Leaders prioritize business goals. The team prioritizes tasks. But the data and context that connect these two remain missing.
So, here’s the simple and fresh way to look at OKRs alignment.
Layer 1: Workflow Signals (How Engineering is Actually Flowing)
These are the signals that come from day-to-day work. These are the traces of real behaviour.
- Cycle time
- Review time
- Deploy frequency
- Rework rate
- Defect Density
These signals tell us the truth about engineering health. If they slip, OKRs slip, even if dashboards show everything in green. These work signals show drift in OKRs way earlier.
Layer 2: Outcome Signals (Did the Work Change Anything?)
This is where engineering work meets product reality or product ambition.
- User impact
- Reliability
- Load handling
- Support tickets
- Cost efficiency
These outcome signals map directly to value. They stop teams from writing KRAs (key results areas) like - Close 40 refactor tickets. Instead, they give priority to KRS, like - Cut post-release bugs by 30%.
Layer 3: Business Signals (Where Engineering Drives Big Impact)
These are the metrics that leaders care about.
- Adoption
- Retention
- Revenue influence
- LTV increase
The great thing about engineering is - leaders don’t have these business metrics right away with them. But engineering shapes them through stability, speed, and quality.

The 3R Method - Writing OKRs That Don’t Drift
OKRs need guardrails. You can keep it safe from noise with this 3R method.
1. Relevance - Does This KR Matter to the Business?
Bad OKRs - Improve code quality.
Better OKRs - Cut defect escape rate from 5% to 2% to boost user trust.
2. Reliability - Can We Track it Through Signals?
If you can’t measure KR in real-time, it’s not a key result, it's a wish!
3. Range - What’s the Acceptable Performance Band?
Don’t set a binary target. Don’t treat it like a light switch - either you hit the number or don’t. Instead, set a performance band, not a single hard target. It solves two problems…
- Panic when the team thinks they are failing
- Sandbagging, where teams set safe targets
For example, instead of a fixed target - Reduce cycle time from 12 days to 5 days, use a band, reduce cycle time from 12 days to a healthy band of 5–7 days.
Engineering Metrics That Make OKRs Strong (Not Hallucinated)
One Engineering Metric (data) + One Outcome Metric (value) = A Strong KR!
Not merging these two is the real cause of OKRs drift and OKRs hallucination. Merging these changes the scenario entirely - it tracks how the team is working and what the impact or value it is creating for the customer or the business.
This pair also helps teams avoid chasing the speed at the cost of stability, or chasing stability at the cost of product flow.
The following paired KRs are for the Objective of: Improve delivery flow while keeping product quality stable with high user trust.
- Cycle Time <> Predictable Delivery
Cycle time depicts how long engineering work takes from start to finish. Shorter cycle time means fewer bottlenecks, fewer surprises, and more stable releases.
KR Example: Bring cycle time down to 6 days to make releases more predictable for the product team.
- Deployment Frequency <> Product Agility
Deployment frequency isn’t about shipping in tiny pieces. It is about how often you can push stable work to the user front without breaking anything.
A healthy deployment rhythm shows that your pipelines are clean, optimized for AI-assisted coding, reviews move on time, and the team turns ideas into work with less friction.
KR example: Increase deployment frequency to twice a week so updates reach users faster and shorten idea-to-impact time.
- MTTR <> User Trust
Incidents do happen. What matters more is how fast you recover. The lower MTTR score depicts strong observability and tight response loops.
KR example: Cut MTTR from 90 minutes to 30 minutes to reduce downtime impact on users.
- Change Failure Rate <> Deployment Quality
Change Failure Rate reveals how many releases cause issues, rollbacks, or hotfixes. It connects engineering speed with engineering safety.
KR example: Bring the change failure rate below 10% to support safer, faster deployments.
You must also read: What are the DORA metrics?
- Defect Density <> Product Stability
Defect density is all about bugs that slip into production. Escapes erode trust and create cycle-time debt.
KR example: Reduce defect density to under 2% to strengthen product stability.
- AI-Generated Code % to Production <> Engineering Leverage
You deploy AI tools and provide L&D resources to your team to leverage AI in engineering. And you track how much of your codebase is written through AI tools and has gone into production. This shows how much the team is using AI-assisted coding efficiently.
KR example: Increase AI-generated code push to merge to 40% for faster delivery on core modules.
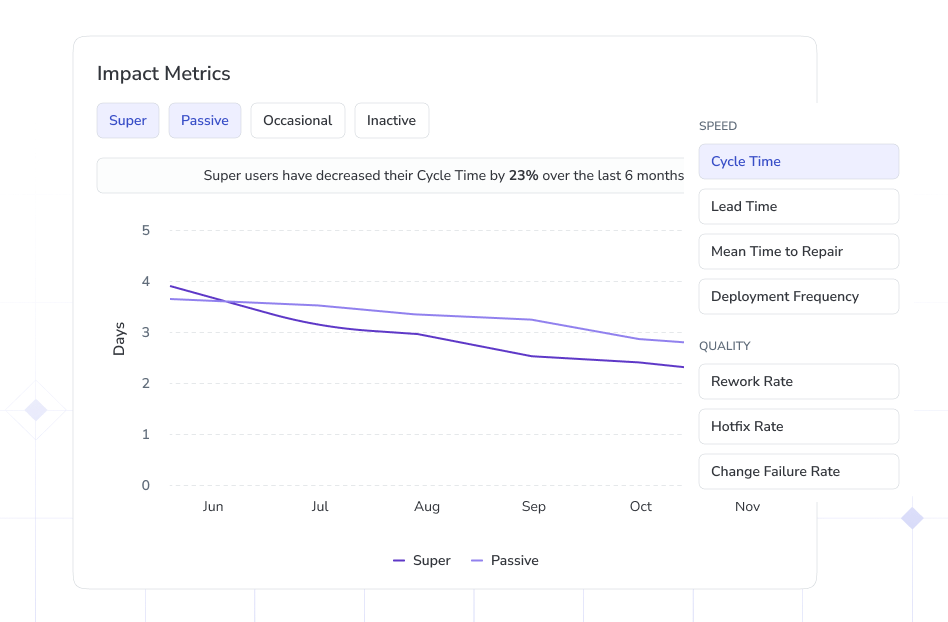
The below image shows that from AI coding user cohort the Super users was able to lower Cycle Time by 23% than Passive users.
- AI Suggestion Acceptance Rate <> Trust & Depth of Usage
If engineers accept AI suggestions, but those suggestions create more rework later, you have poor code governance practices in place.
KR example: Improve useful-suggestion rate (accepted without rework) by 20% to cut back on churn.
How Hivel Turns Engineering OKRs Into Real Alignment Signals Between Data & Value
Most engineering teams don’t suffer from a lack of OKRs. They suffer from a lack of alignment.
Cycle time, MTTR, change-failure rate, AI-generated code - these signals are powerful only in one scenario - when you see context within them.
These signals or data must first be traceable and measurable before they become values that can be sensed at the business, product, and user levels.
Hivel reads engineering reality through live signals from GitHub, Jira/Linear, CI/CD, deployments, AI-coded lines, review patterns, rework loops, incident recovery, and stability patterns.
With Hivel, you can set speed, quality, and throughput goals and watch real-time performance against them.
Hivel doesn’t just track numbers. It understands multi-dimensional context.
It connects,

Hivel, in fact, goes beyond this. Rather than simply treating these as vanity metrics, it stitches them into the OKRs so leaders can see why something is moving…
- How cycle time is bending the delivery flow
- How the increase in rework is linked to AI-generated code patterns
- How AI adoption and suggestion acceptance shape output, not just speed
- How PR volume, review delay, and context-switch load impact developer burnout
Modern engineering teams adopting Hivel see these three changes straightaway…
- Their OKRs stop hallucinating.
- Their metrics stop lying.
- And their engineering team stops running on gut feel.
Because Hivel is an analytics-driven OKRs alignment engine for engineering teams.
Try Hivel to See What’s Working, What’s Drifting, and What Needs Help - in Real Time
FAQs
1. What makes a “good” engineering OKR?
Bad OKRs talk about efforts. Good OKRs talk about impact and value. In other words, a good engineering OKRs connect how the team works with why it matters. It should link engineering signals like cycle time, CFR, MTTR, rework, and PR flow with an outcome that adds value to the product or the business.
2. How to link OKRs to metrics?
Always link metrics to Key Results (KRs) and not to the Objective itself. Because the Objective tells the story and the Key Results tell the numbers. Metrics live inside the Key Results. It’s a simple formula: One Engineering Signal + One Outcome Signal = A Strong KR. Pick metrics that show the team’s work and the outcome of that work. If the metric cannot add value or user impact, don’t use it for OKRs.
3. How to track OKRs' progress effectively?
One should always track OKRs' progress through live engineering data and not through monthly check-ins or color-coded spreadsheets. The best way to track OKRs is to track their associated metrics that change every day. Software Engineering Analytics tools like Hivel make this simple by pulling signals from GitHub, Jira/Linear, CI/CD, & AI coding tools and correlating them with set goals.