This is neither a feature blog nor a celebration of AI progress. This is a pause - a warning for Engineering Leaders.
Across engineering, AI adoption appears to be strong. Teams are loving it, and dashboards show growth.
But growth in what?
More AI usage.
More AI suggestions acceptance rate.
It would not take even a second to comprehend that these two lazy proxies to measure AI adoption are fundamentally broken.
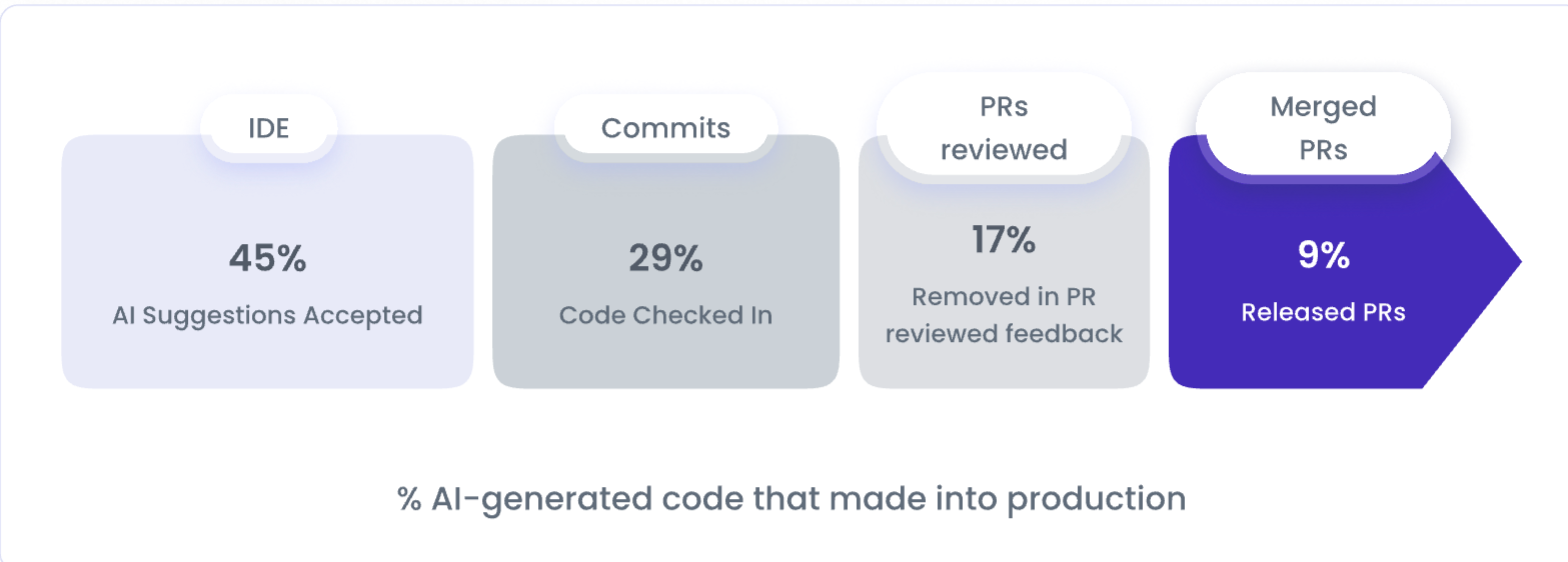
Because production is the only place where AI creates value - or creates waste. And none of these metrics answer the only question that matters: How much AI-written code actually reaches production?
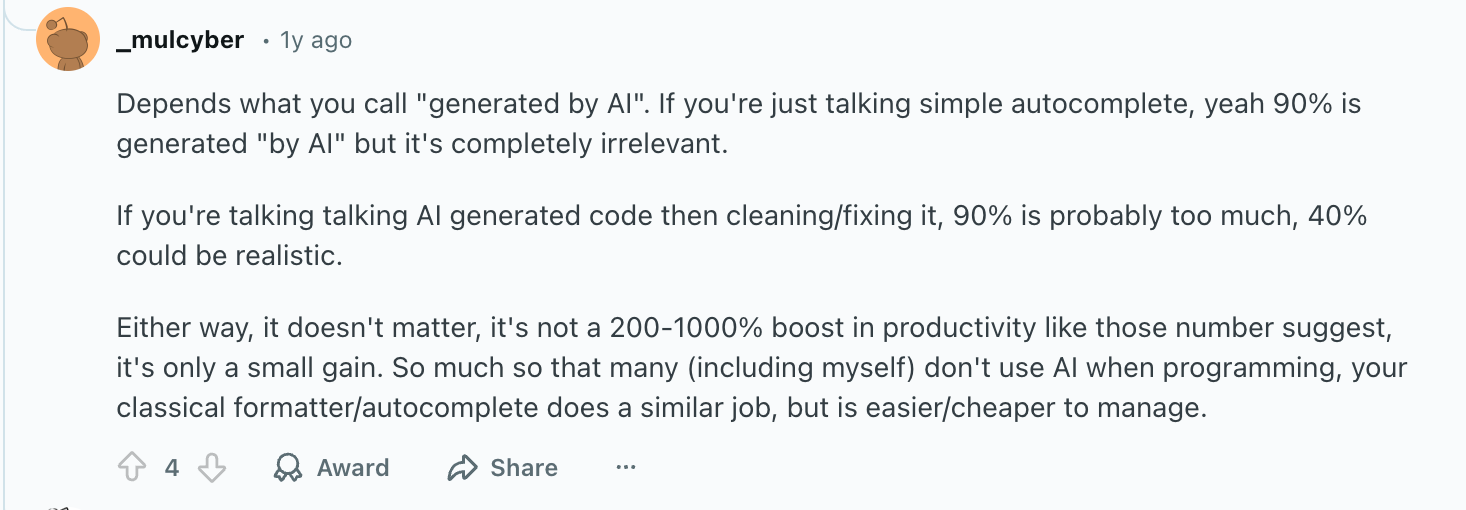
Everywhere I find, people limit their discussions to what percentage of code is now written by AI and not how many AI LOC are pushed into production. Even in this Reddit thread!
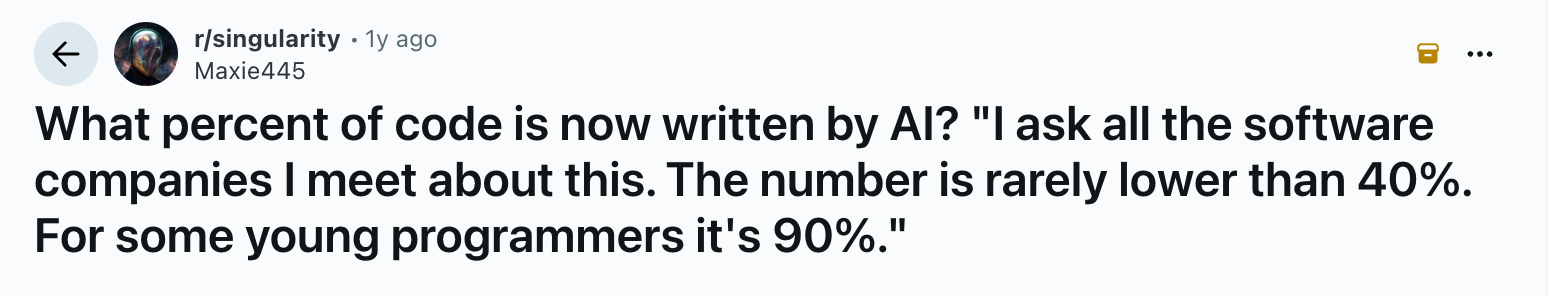
A developer accepts more than 80% of AI suggestions or writes even 30% of code, even at Microsoft, but that does not mean most of that code ships.
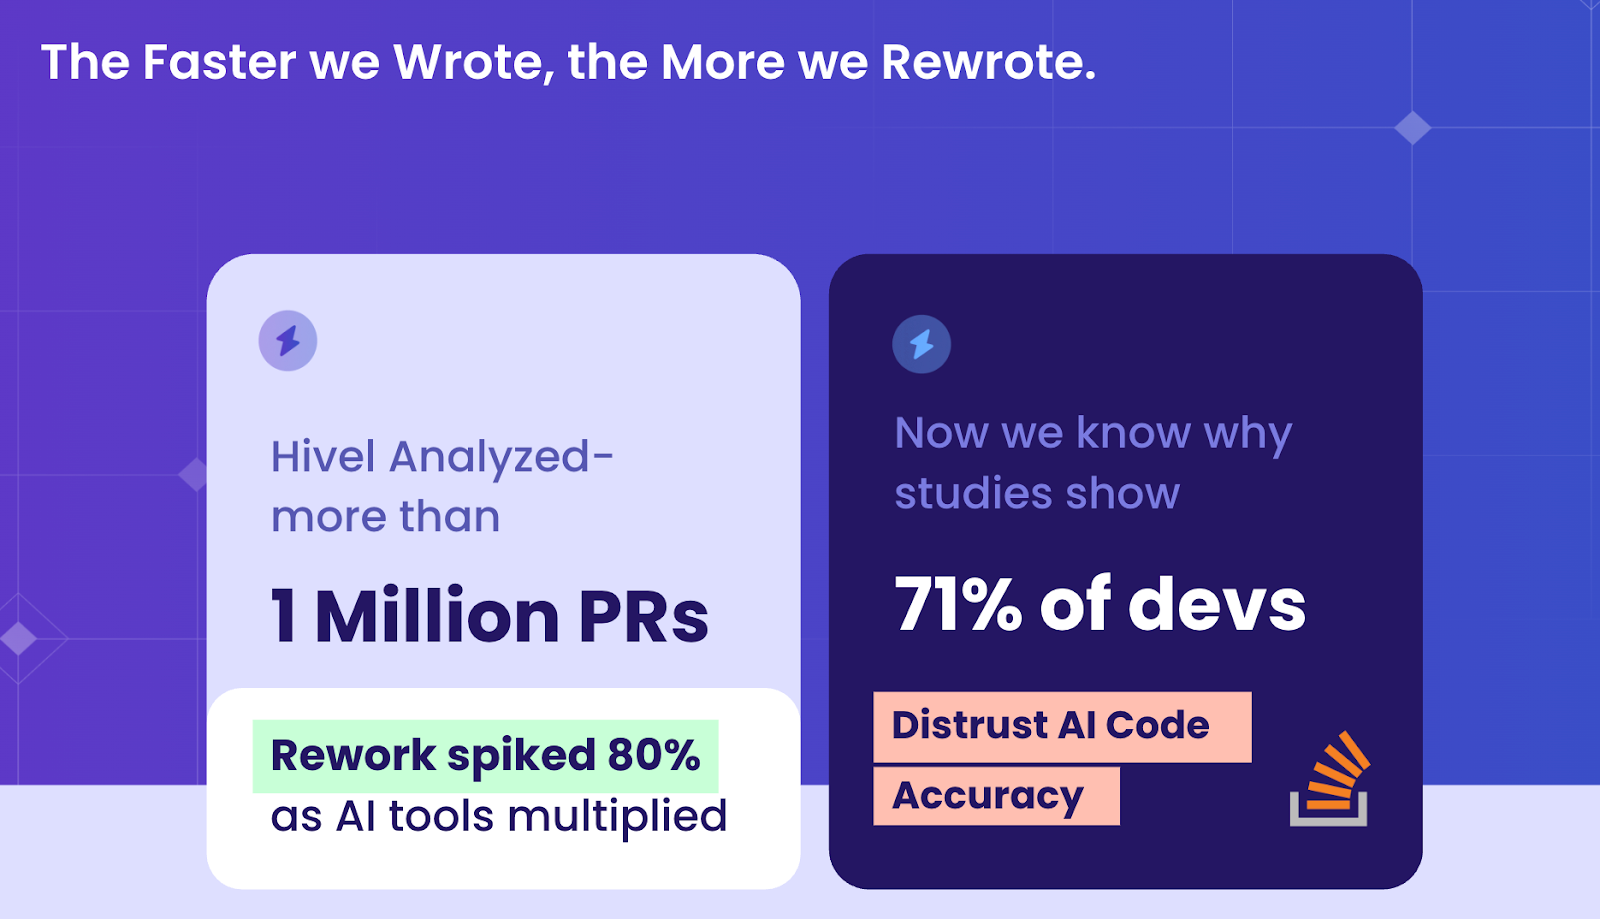
According to the 2025 Stack Overflow Developer Survey, 71% of developers distrust the accuracy of AI code. And when we analyzed more than 1 million PRs, we got to know why developers do not yet fully prefer AI code, as it spiked rework to a whopping 80%.
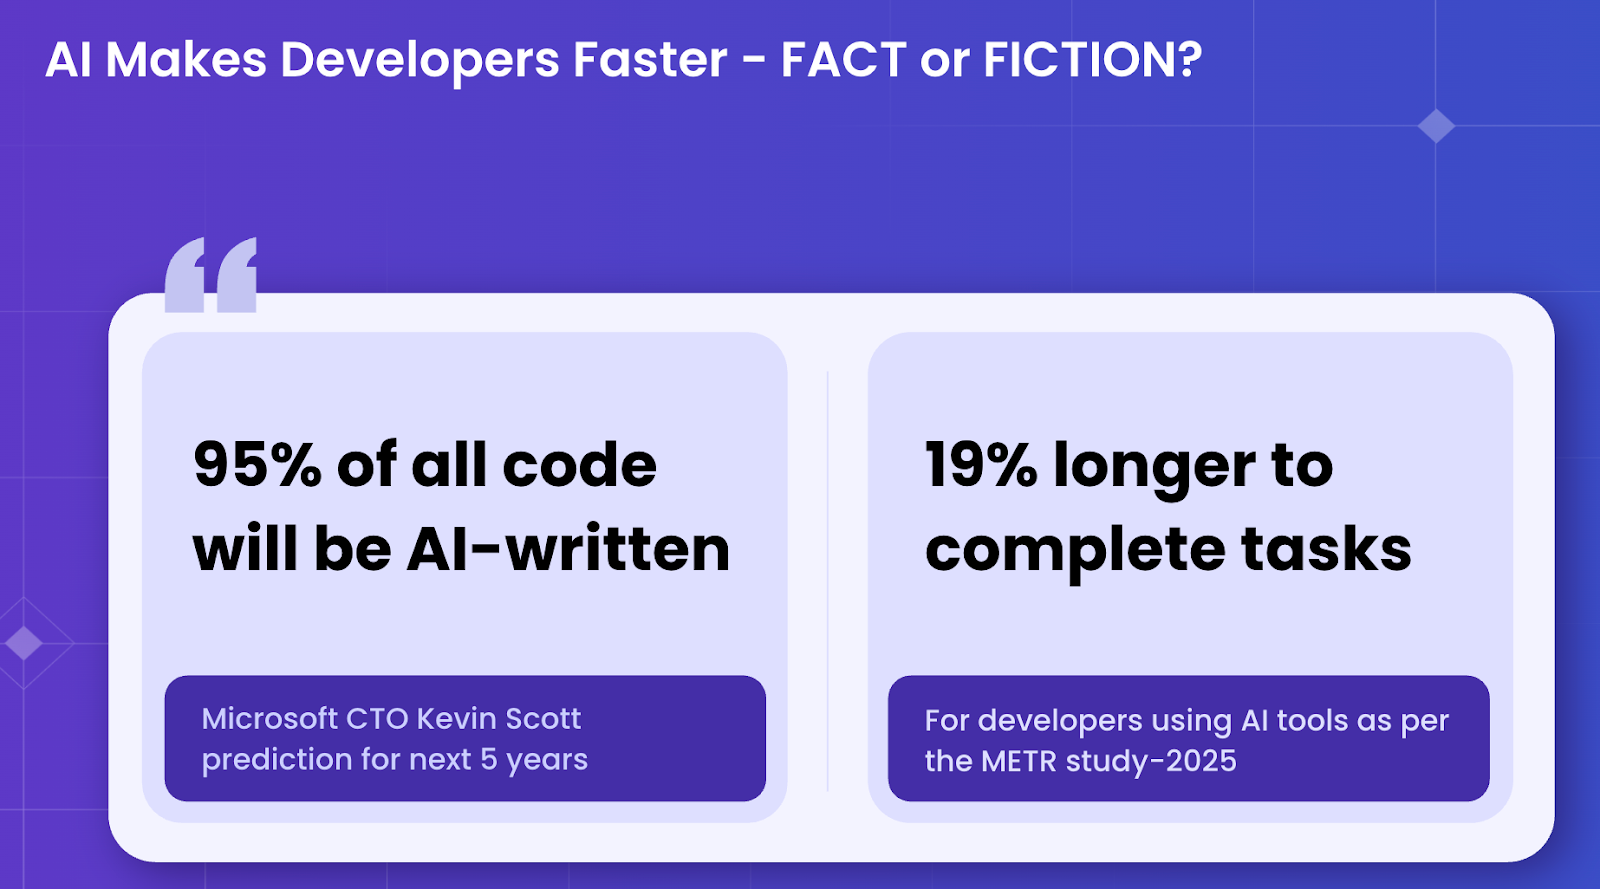
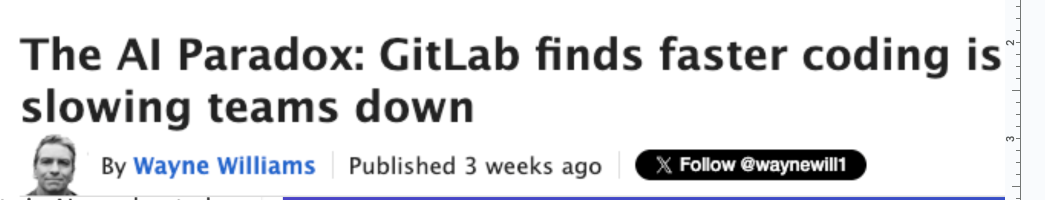
There are plenty of real cases available where, instead of helping teams, AI adds friction to flows and slows down the team (according to METR research), or in worst-case scenarios, it introduces unprecedented security issues and outages costing millions and billions to businesses.
These are not edge cases, but real incidents, and data depicting a well-structured mechanism is needed to understand how AI is interacting with your flows, teams, and other tools before simply coming to any conclusion by measuring AI adoption with simply asking how many AI suggestions a developer accepts!
The reality is, engineering leaders lacking a true analytics + intelligence layer and making decisions purely based on wrong metrics can never have answers to…
- How much of AI-written code is removed during review, and how does it cause review bottlenecks?
- How much of AI-written code is actually shipped to production?
- How much of AI-written code increases rework?
- How long does AI-generated code operate in production without requiring maintenance?
- When failures occur, how does MTTR for AI-generated code compare to human-written code?
- How much AI-written code makes dashboards celebrate activity, but makes the SDLC absorb the cost?
This is how doomsday metrics are born. When AI adoption & ROI are measured in activities and not in impact, AI strategy slowly drifts in the wrong direction.
The only way to determine if your AI strategy is drifting in the wrong direction is to pause and ask, have we also been considering Accepted = Shipped?
And if yes, keep reading.
Why ‘Accepted’ Became the Most Dangerous AI Metric
‘Accepted’ became the prominent metric to measure AI adoption because it is easy.
Easy to capture. Easy to chart. Easy to explain in leadership updates. One number. One trend line. One story.
If you want to test this metric by yourself, just try to answer these questions by keeping the ‘AI Suggestions Accepted’ metric as a baseline.
- If acceptance goes up, but cycle time stays flat, is AI hurting your system or helping it?
- If reviewers invest more time cleaning AI-generated code, where does that cost appear?
- If AI code is accepted early but removed later, do you see that - or does it disappear from your metrics?
- If pull requests grow larger and reviews slow down, is AI suggestion acceptance still a success signal?
- If AI code passes the review but later causes incidents, would acceptance ever warn you?
And the hardest ones - if you had to explain how accepted AI code improves your delivery system, could you?
Because it’s a comfort metric, not an impact metric, accepted fails to answer system-level questions.
That’s because acceptance happens at the earliest point in the system, before reviews, tests, and security, and ignores everything that happens afterward.
AI vendors love this metric because it’s easy to inflate higher tool usage, but an accepted suggestion is just technical debt until it’s actually shipped and doesn’t add value until it reaches production.
Why “AI Adoption Metrics” Collapse at the Deployment Gate
A growing number of organizations now claim AI adoption success based on a deceptively simple number of employees using AI tools.
This is where the narrative quietly breaks.
That number only proves AI exists in the workflow, not that it improves delivery. Occasional AI use and production-critical AI code are counted the same. Even AI-generated code removed during review still inflates “adoption.”
This isn’t adoption. It’s activity mistaken for impact.
Headcount is an input; delivery outcomes are results. When leaders conflate the two, AI looks successful while cycle time stalls, review load grows, and quality risks rise.
AI creates value only if its output survives reviews, deployment, and production. Until adoption is measured there, participation will keep masquerading as progress.
How Hivel Fixes the Doomsday AI Adoption & ROI Metrics
It’s a horrifying truth for the Hivel team to accept that most leaders are making AI decisions with good intent - and incomplete truth.
The industry has normalized measuring AI adoption by measuring activities and not consequences or impact.
Hivel exists to correct that shift.
No, we are not introducing another metric and making this even more complicated. We are simply changing where measurement begins.
Hivel measures AI impact after reviews, after quality gates, in production. What survives is counted, what is removed is also counted. And then Hivel contextually correlates every signal across usage, acceptance, stability, review, rework, and incidents, to show what actually changes after AI enters the system.
This reframes AI adoption for leaders. There are three immediate changes:
- They stop asking if AI is being used and see if it’s helping teams ship faster.
- They stop celebrating acceptance and start improving system stability.
- They stop assuming impact and see exactly where AI improves flow or adds friction.
This clarity matters for leaders because leadership decisions compound over time!